exaFOAM Performance Analysis and Modeling
 Kreutzer_Sebastian_exaFOAM Performance Analysis and Modeling_Fig1
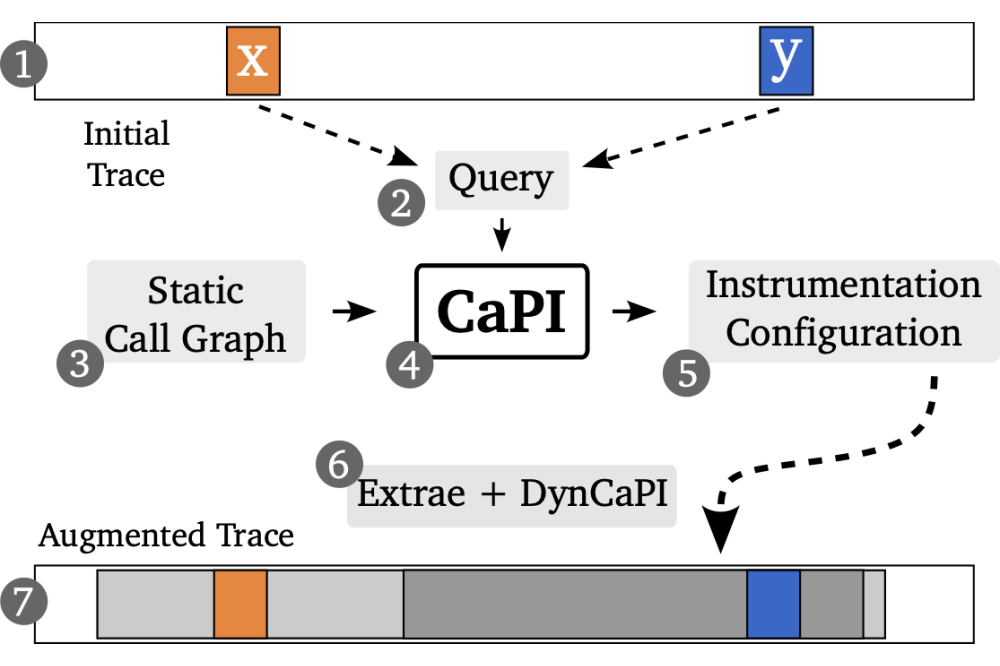
Figure 1: High-level overview of the trace augmentation workflow.
Sebastian Kreutzer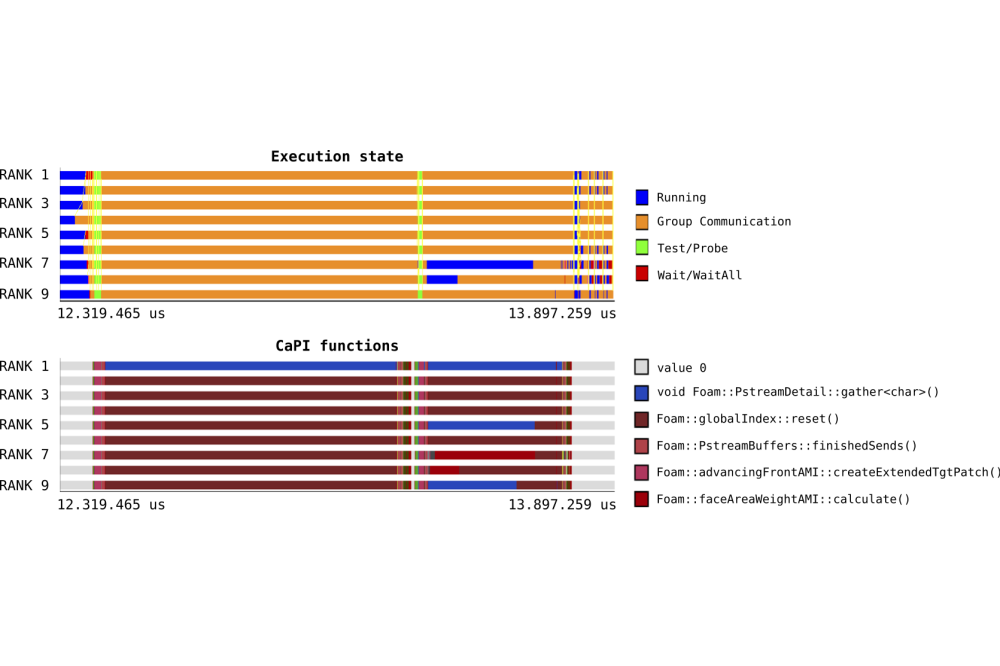 Kreutzer_Sebastian_exaFOAM Performance Analysis and Modeling_Fig2
Figure 2: Original and augmented traces of an OpenFOAM benchmark displaying load imbalance issues. The augmented trace shows information about individual function calls that cannot be inferred from the MPI trace alone.
Sebastian KreutzerIntroduction
The exaFOAM project [1] aims at overcoming the current limitations of Computational Fluid Dynamics (CFD) technology, especially in what concerns the exploitation of massively parallel HPC architectures. This involves the development and validation of a range of algorithmic improvements, across the entire CFD process chain (preprocessing, simulation, I/O, post-processing). The performance assessment of both existing and newly developed code is essential in order to find scalability issues and guide further development. To this end, we are developing specialized performance measurement tooling, aimed at large-scale scientific codes. The use of HPC resources is vital in the assessment of these new tools and their application on OpenFOAM benchmark cases. In a previous project period, we have developed CaPI [2] , a tool for the creation of tailored instrumentation configurations of large-scale HPC codes. This tool supports the analyst in the creation of instrumentation configurations with minimal measurement overhead, thus ensuring the collection of accurate performance data. Within this project period, we have developed a new method for augmenting MPI-based traces. These traces normally only record MPI communication, enabling the analyst to detect performance issues while keeping the trace size reasonable. The drawback of this method is a lack of source code information for the investigated trace regions, making it hard to locate root causes in the code base. We have developed an extension to CaPI that leverages static analysis to selectively instrument problematic trace regions. This enables a direct correlation between trace and source code, while keeping the runtime and storage overhead low.
Methods
Figure 1 shows a high-level overview of the trace augmentation approach. The analyst starts out with the original MPI trace and identifies calls x and y that encapsulate a critical trace section (1). Based on these calls, he constructs a query and passes it to CaPI, alongside a static whole-program call graph of the target application (2-4). CaPI performs a static common ancestor analysis and creates an instrumentation configuration that includes parts of the program relevant to the specific region (5). This configuration is then used to create a new augmented trace that includes detailed information for the problematic trace region (6-7).
The static analysis is based on identifying potential dynamic lowest common ancestors (dLCAs) of the two calls paths corresponding to the two surrounding MPI calls x and y in the static call graph. These are computed by first identifying common ancestors of x and y and computing a list of post-dominators. The graph is then traversed bottom-up and function nodes are marked as dLCA candidates, if there are no common post-dominators w.r.t. x and y. Since complex call graphs can lead to many potential dLCAs, a heuristic filtering method is applied to only select the most important code regions. The final set of selected functions and all relevant call paths is then instrumented using a hybrid instrumentation method based on LLVM XRay.
Results
Evaluation on Lichtenberg II and CLAIX, using several representative call graphs from proxy applications and large OpenFOAM benchmarks, showed that the critical trace region could be identified and instrumented in all cases. The observed overheads were below 15% for runtime and 10% for trace size. This is a significant reduction compared to using an alternative approach based on stack unwinding, which produced overheads up to 31% and 133% respectively. The resulting augmented traces (example shown in Figure 2) contain detailed information about each function call in the investigated region, therefore simplifying further investigation.
Discussion
The developed method enables the analyst to gain detailed information about critical trace regions and has been successfully applied to indentify performance issues within OpenFOAM. Drawbacks of the approach is the reliance on a whole-program call graph and the need for re-running the application to recored the augmented trace. For future work, we are looking into dynamically adapting the level of tracing in order to collect all relevant information within a single run.