Performance Measurement Techniques
Introduction
In light of the complexity and diversity of current HPC platforms, programmers need to understand application execution behavior in order to identify performance bottlenecks and to support the compiler in generating efficient code. To this end, performance analysis tools use runtime measurements to provide information of the applications runtime behavior. Two established and widely used methods to gather such information are sampling or the instrumentation of the application. Each method has its advantages and disadvantages in terms of induced measurement overhead, measurement-control, data quality and the capability to map the data back to the source code.
Methods
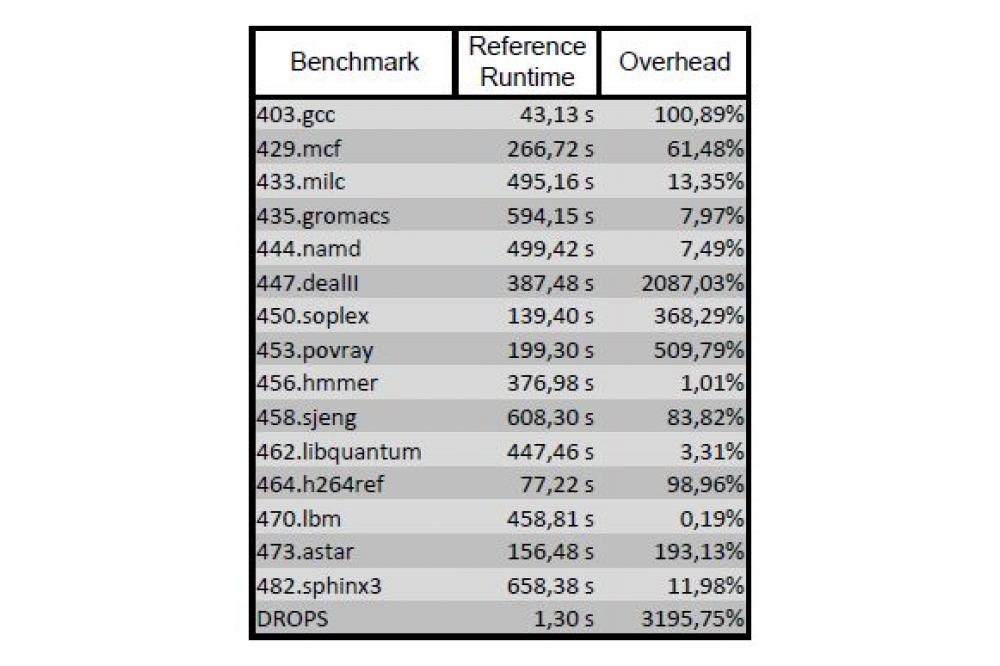
Instrumentation is the modification of the application to induce measurement points, so called probes, in the application in order to gather the required information. The correlation to the source is implicit by the instrumentation location. These probes are either injected manually by the user, or automatically either by the compiler or a dedicated instrumentation tool. The runtime overhead for such an approach is composed of the overhead of all the probes (typically implemented by calls to a measurement library) and the frequency at which the individual probes are invoked at runtime. While the overhead of a single probe usually can be considered constant, the number of probe invocations is difficult to control when using current instrumentation technology. For example, C++ applications instrumented with current methods provided by tools like Scalasca or Vampir exhibit trillions of probe invocations during the applications runtime resulting in tremendous overheads (see Table). Summarizing, the conceptual overhead of instrumentation (Oinstr.) can be expressed as a product of the probes overhead (OProbe) and the number of probe invocations (ninvoc.): Oinstr.=OProbe*ninvoc. Sampling typically denotes the statistical gathering of relevant data during an applications execution by programming hardware interrupts (event based sampling, e.g. timer or executed instructions). In order to map the information back to the code, sampling tools read the program counter and analyze the call stack and the binary to derive the precise context for the sample, i.e. call path and source location. While mapping the sample to the source code relies on the debug information of the binary and can be obtained offline, the unwinding of the call stack must be done at runtime, as the context is potentially lost after the sampling event. As the precise structure of the call stack, that is its depth and composition, is unknown a priori, the tool has to unwind the call stack back to a known location, such as the main function. This unwinding is complex and costly. Therefore, several optimizations are applied to reduce the cost of unwinding, e.g. caching the lastanalyzed call stack state, adding markers to the call stack or unwinding only specific samples. However, the overhead of sampling remains dynamic and sample location dependent.
Results
Summarizing, the sampling overhead (Osampl.) is expressed as the sum of all the overheads of all the different sample locations O(loc.) times the number of samples taken at that location n(loc.): Osampl.= SUM(O(loc.)*n(loc.))
Using the Lichtenberg cluster, we evaluate and validate novel techniques to reduce incurred measurement overheads required for performance analysis whilst maintaining expressive data suitable for performance analysis.


