Calculating Photoelectron Binding Energies on Organic Molecules to Assist Photoemission Spectra Interpretation
 Frericks, Markus_Calculating Photoelectron Binding Energies on Organic Molecules to Assist Photoemission Spectra Interpretation
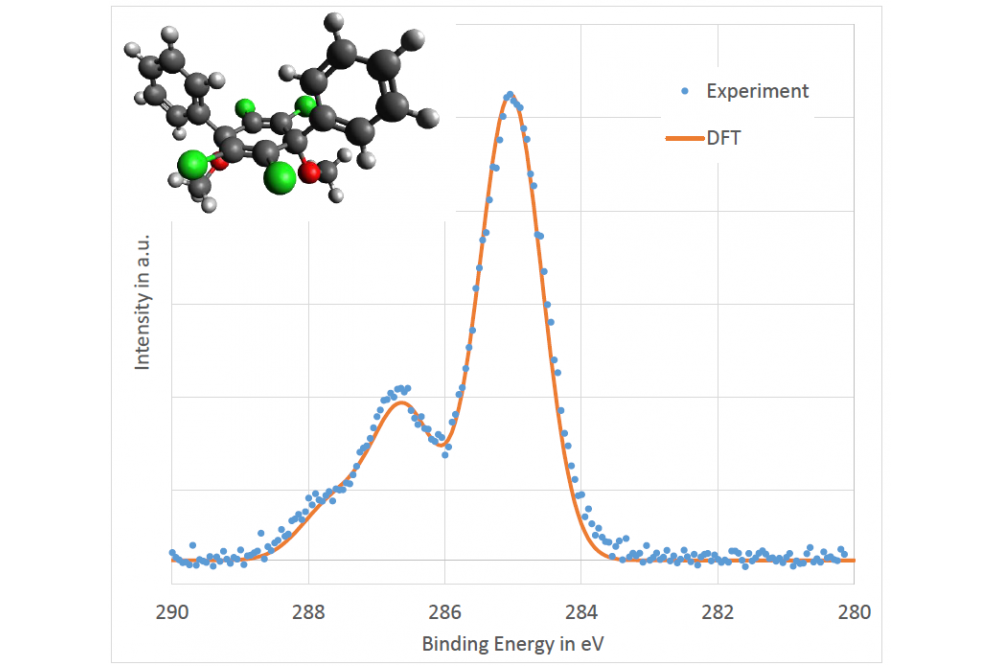
Figure 1. Comparison of the carbon 1s orbital emission spectrum obtained from photoelectron spectroscopy measurements and DFT calculations. The structure of the studied molecule is shown in the left top corner (C – dark grey, H – light grey, Cl – green, O - red).
Markus FrericksIntroduction
The photoelectron spectroscopy data of organic molecules, in our case organic semiconductors, are mainly dominated by the emission from the Carbon 1s orbital. The binding energy of the electron in said orbital is slightly altered by the chemical surrounding of the carbon atom in the molecule. As a result, the measured C 1s spectrum is not a simple gaussian shaped peak but a more complex shape. It consists of multiple emission lines from all the carbon atoms with slightly different binding energies which, however, are too close to distinguish them clearly. For the identification of reactions and changes of the molecule and the atoms at which these take place it is important to relate the spectrum to the single atoms in the molecule. By using density functional theory (DFT) calculations, the binding energies of the different C 1s electrons in a molecule shall be determined and then the be compared to the measured spectrum. If the calculated spectrum shape matches the experimental one, in the future, observations on the change of the spectral shape could be related to a certain atom in a molecule.
Methods
To calculate the binding energies of C 1s electrons DFT is used. For the software to perform the calculations, GPAW is chosen. It provides an easy to use basis while offering multiple features and possibilities and is free of charge. Further, the calculations can be performed in parallel very well and the calculation time scales well with the number of used cores. Such it is ideal for calculations on a cluster. The molecule structures are drawn in Avogadro and then pre-optimized using the MMFF94s force field and a steepest decent algorithm. The obtained structure is exported and used as starting point for the DFT calculations. Before optimizing the structure further, the simulation cell and grid spacing for the finite-difference approximation is defined. The related parameters are varied till the change in total energy is in the range of meV. Here spin-paired calculations are used, as it reduces the computation time. Next, the structure is optimized this time with spin polarized calculations. For the optimization, a “QuasiNewton” algorithm is used until the atomic forces are below 0.05 eV/Å. The total energy of the structure optimized molecule represents the energy of the ground state. Then, using a functionality of GPAW, carbon pseudo potentials with a missing electron in the 1s orbital are generated. In several calculations this pseudo potential is placed on every carbon atom of the molecule. The obtained total energies represent the excited states of the ionized atoms. The difference between ground state and excited state represents the binding energy of the electron of the carbon atom where the modified pseudo potential was placed. For all calculations, a PBE potential is used.
Results
The first studied molecule consists of a central aromatic ring with two phenyl groups, four chlorine atoms and two methoxy group. The molecule can be dissolved and spin-coated into a thin film. If the thin film is heated the methoxy groups are going to split leaving a conjugated aromatic central ring. With further increasing temperature the chlorine atoms are supposed to split off during a reaction of crosslinking between molecules. With each reaction step the shape of the carbon 1s orbital emission spectrum changes. To be able to follow the reactions in more detail, the different features of the emissions shall be related to the different carbon atoms in the molecule. From the pre-calculations a quadratic cell of 20 Å with 320 grid points in every direction is used. The resulting grid spacing is about 0.063 Å. With these values the structure is optimized, and the binding energies are calculated on the optimized structure. The resulting binding energies are several eV higher than the ones from the measurement. This is to be expected as the calculation is done for a molecule in the void. While the measurements are performed on a thin film. To compare the calculated values to the measurement the precise binding energy values are used to create a spectrum. Gaussian functions are placed at the respective binding energy positions of the atoms and summed up to create the spectrum of the molecule. Next, the standard deviation and a general binding energy offset (compensating for the isolated molecule vs. thin film effect) is used to adjust the calculated spectral shape to the measured one. The result is a quite good agreement between simulation and experiment and can be seen in Figure 1 together with the molecule structure. The second studied molecule is used for self-assembling monolayers (SAMs). These layers can change the surface properties. They have one so called anchor group which binds to the substrate and one functional group to affect the properties. The DFT calculations are performed as for the previous described molecule and the results are as convincing. A slight mismatch between the calculated spectrum and the measured one could be assigned to another carbon species which was also present on substrate surfaces which were only in contact with the pure solvent. Therefore, is seems that the SAM also consist of some solvent molecules after the preparation. Finally, we moved to a larger molecule. The organic semiconductor, hole transport molecule 4,4′,4′′-Tris[phenyl(m-tolyl)amino]triphenylamine (m-MTDATA). While the first molecule contained 136 and the second 112 valence electrons, m-MTDATA contains 296. As the calculation cost increases with the molecule size, we tested the influence of the used potential as well as cell size and grid spacing on the final effect on the spectrum shape rather than the change of the total energy. However, for the first time, we encounter convergence problems. No matter the cell size, grid spacing, and potential the calculations for the excited states with modified pseudo potentials fail; always for the same four carbon atoms. Changing the density mixing (from 0.25 linare mixing with 3 old densities to 0.1 linear mixing with 5 old densities and a damping of long wave oscillations of 50) reduces the oscillations of the total energy, but not enough to reach a minimum. The changed mixing parameters in combination with an occupation broadening of 0.05 eV (Fermi-Dirac) lead to a convergence. Using this converged solution as a starting point for calculations with reduced occupation broadening and finally no broadening did not work.
Discussion
The results show that the used method can very easily carbon 1s orbital emission spectra which are in good agreement with photoelectron spectroscopy data. Therefore, it is a very promising tool to assist the analysis and interpretation of our measurement. For the first molecule, the carbon atoms with different bonding environments could be identified assisting the observation of the chemical reactions upon heating. The results on the second molecule show that the method is applicable to more than one molecule foreshadow possibilities for further application and more in-depth analysis. In the future, it should be analysed why the obtained binding energy values are not as symmetrical distributed among the atoms as the molecule structure suggests. Further, it might be interesting to calculate the binding energies for SAM molecules adsorbed on a surface. Here, also the orbitals of other elements might be of interest. Finally, m-MTDATA shows that there are convergence issues with larger molecule which need to be solved. Then, also the question of the influence of the cell size, grid spacing and potential on the final simulated spectral structure needs to be addressed again. We also see potential in the simulation of ultraviolet photoelectron spectroscopy of the valence states. The required computational resources are small compared to other projects, but too large for standard computers. The here presented results mark a starting point for a computational assisted interpretation of measurement data that should be further established and explored.