Caption
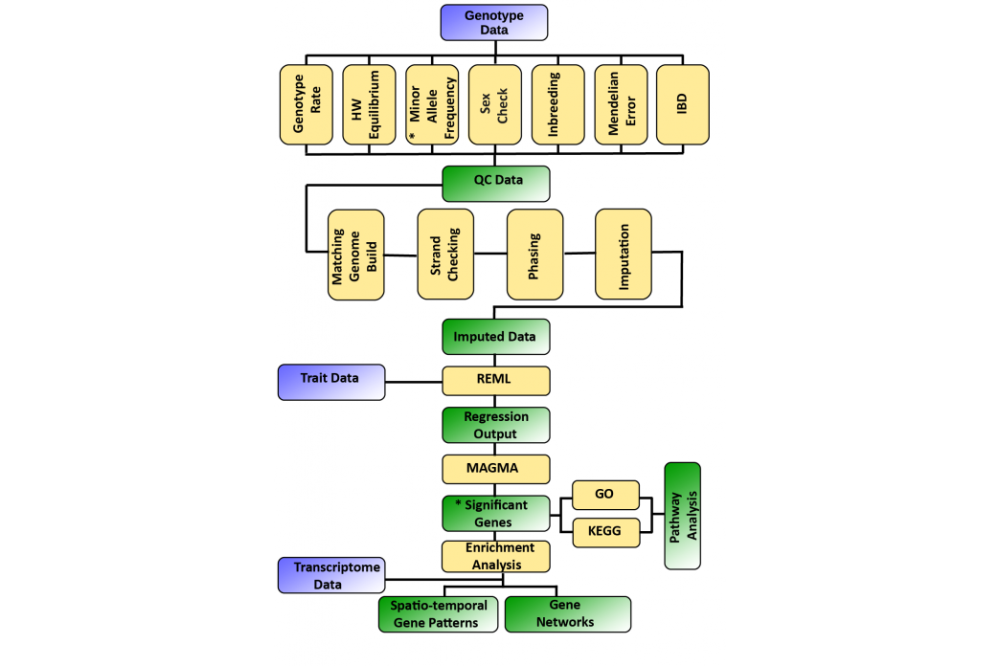
Figure 1: Schematic representation of MAGNET workflow. Purple blocks represent the input data, yellow blocks represent the processing steps, and green blocks the in-processed data. Asterisk* shows the steps where the thresholds can be changed in the pipeline


