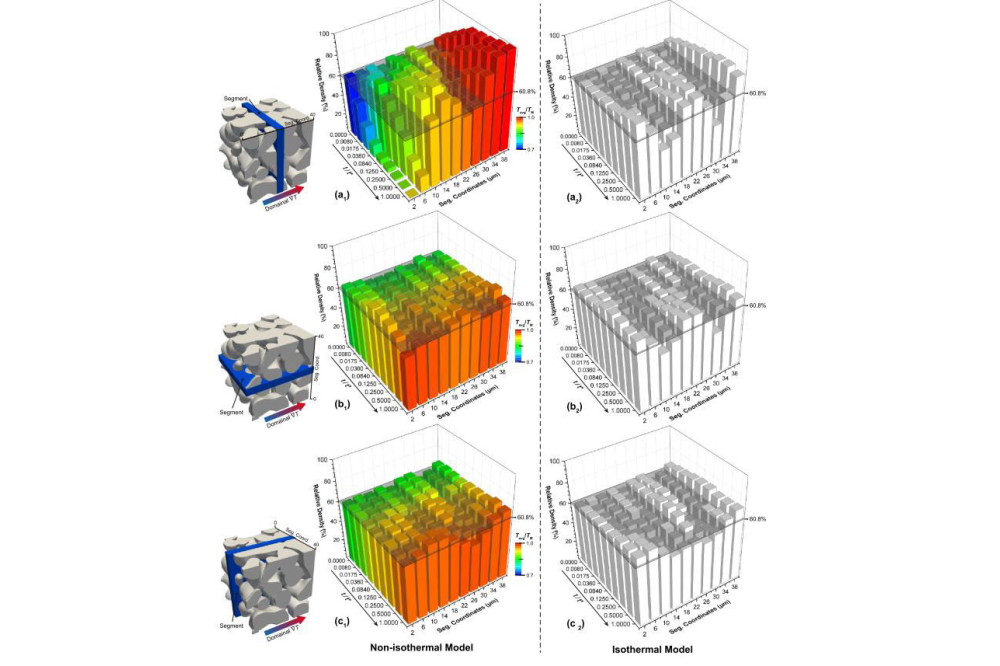
Caption
Figure 2: Spatial-temporal relative density of different segments along directions (a) parallel to domain ∇ T; (b), (c) perpendicular to domain ∇ T. (a1) – (c1) from transient microstructures of non-isothermal model and (a2) – (c2)from ones of isothermal model, with the color denoting the average temperature of corresponding segment.


