Caption
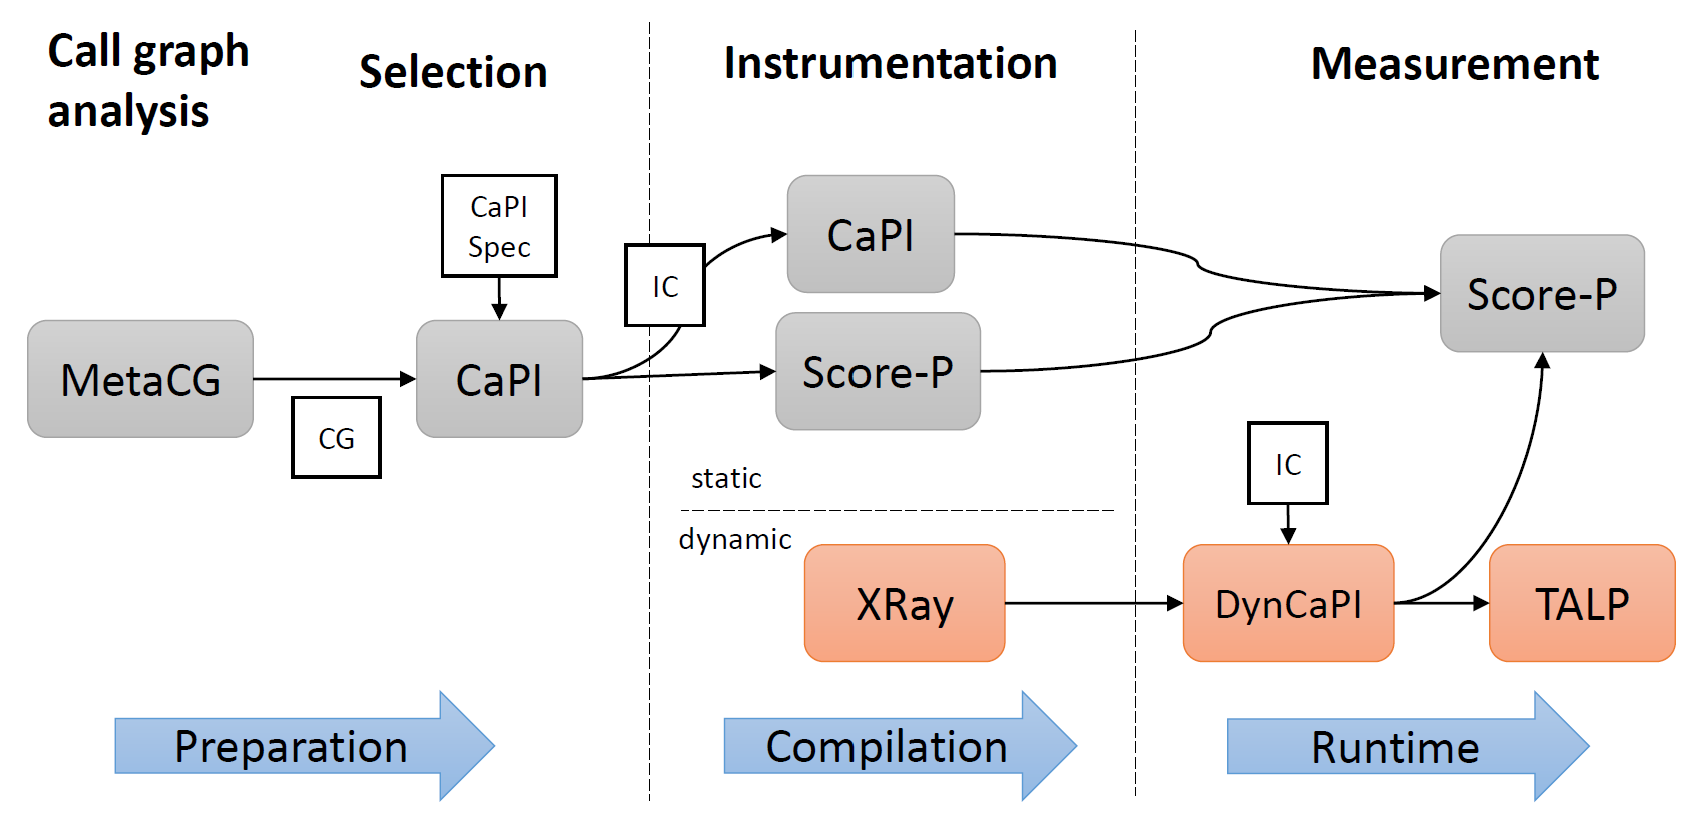
Figure 1: CaPI workflow and components. The labels on top indicate the stages of the instrumentation workflow, while the blue arrows correspond to the time during which they are executed. Previously existing components are shown in gray, components newly added in the context of this work are shown in orange.