Caption
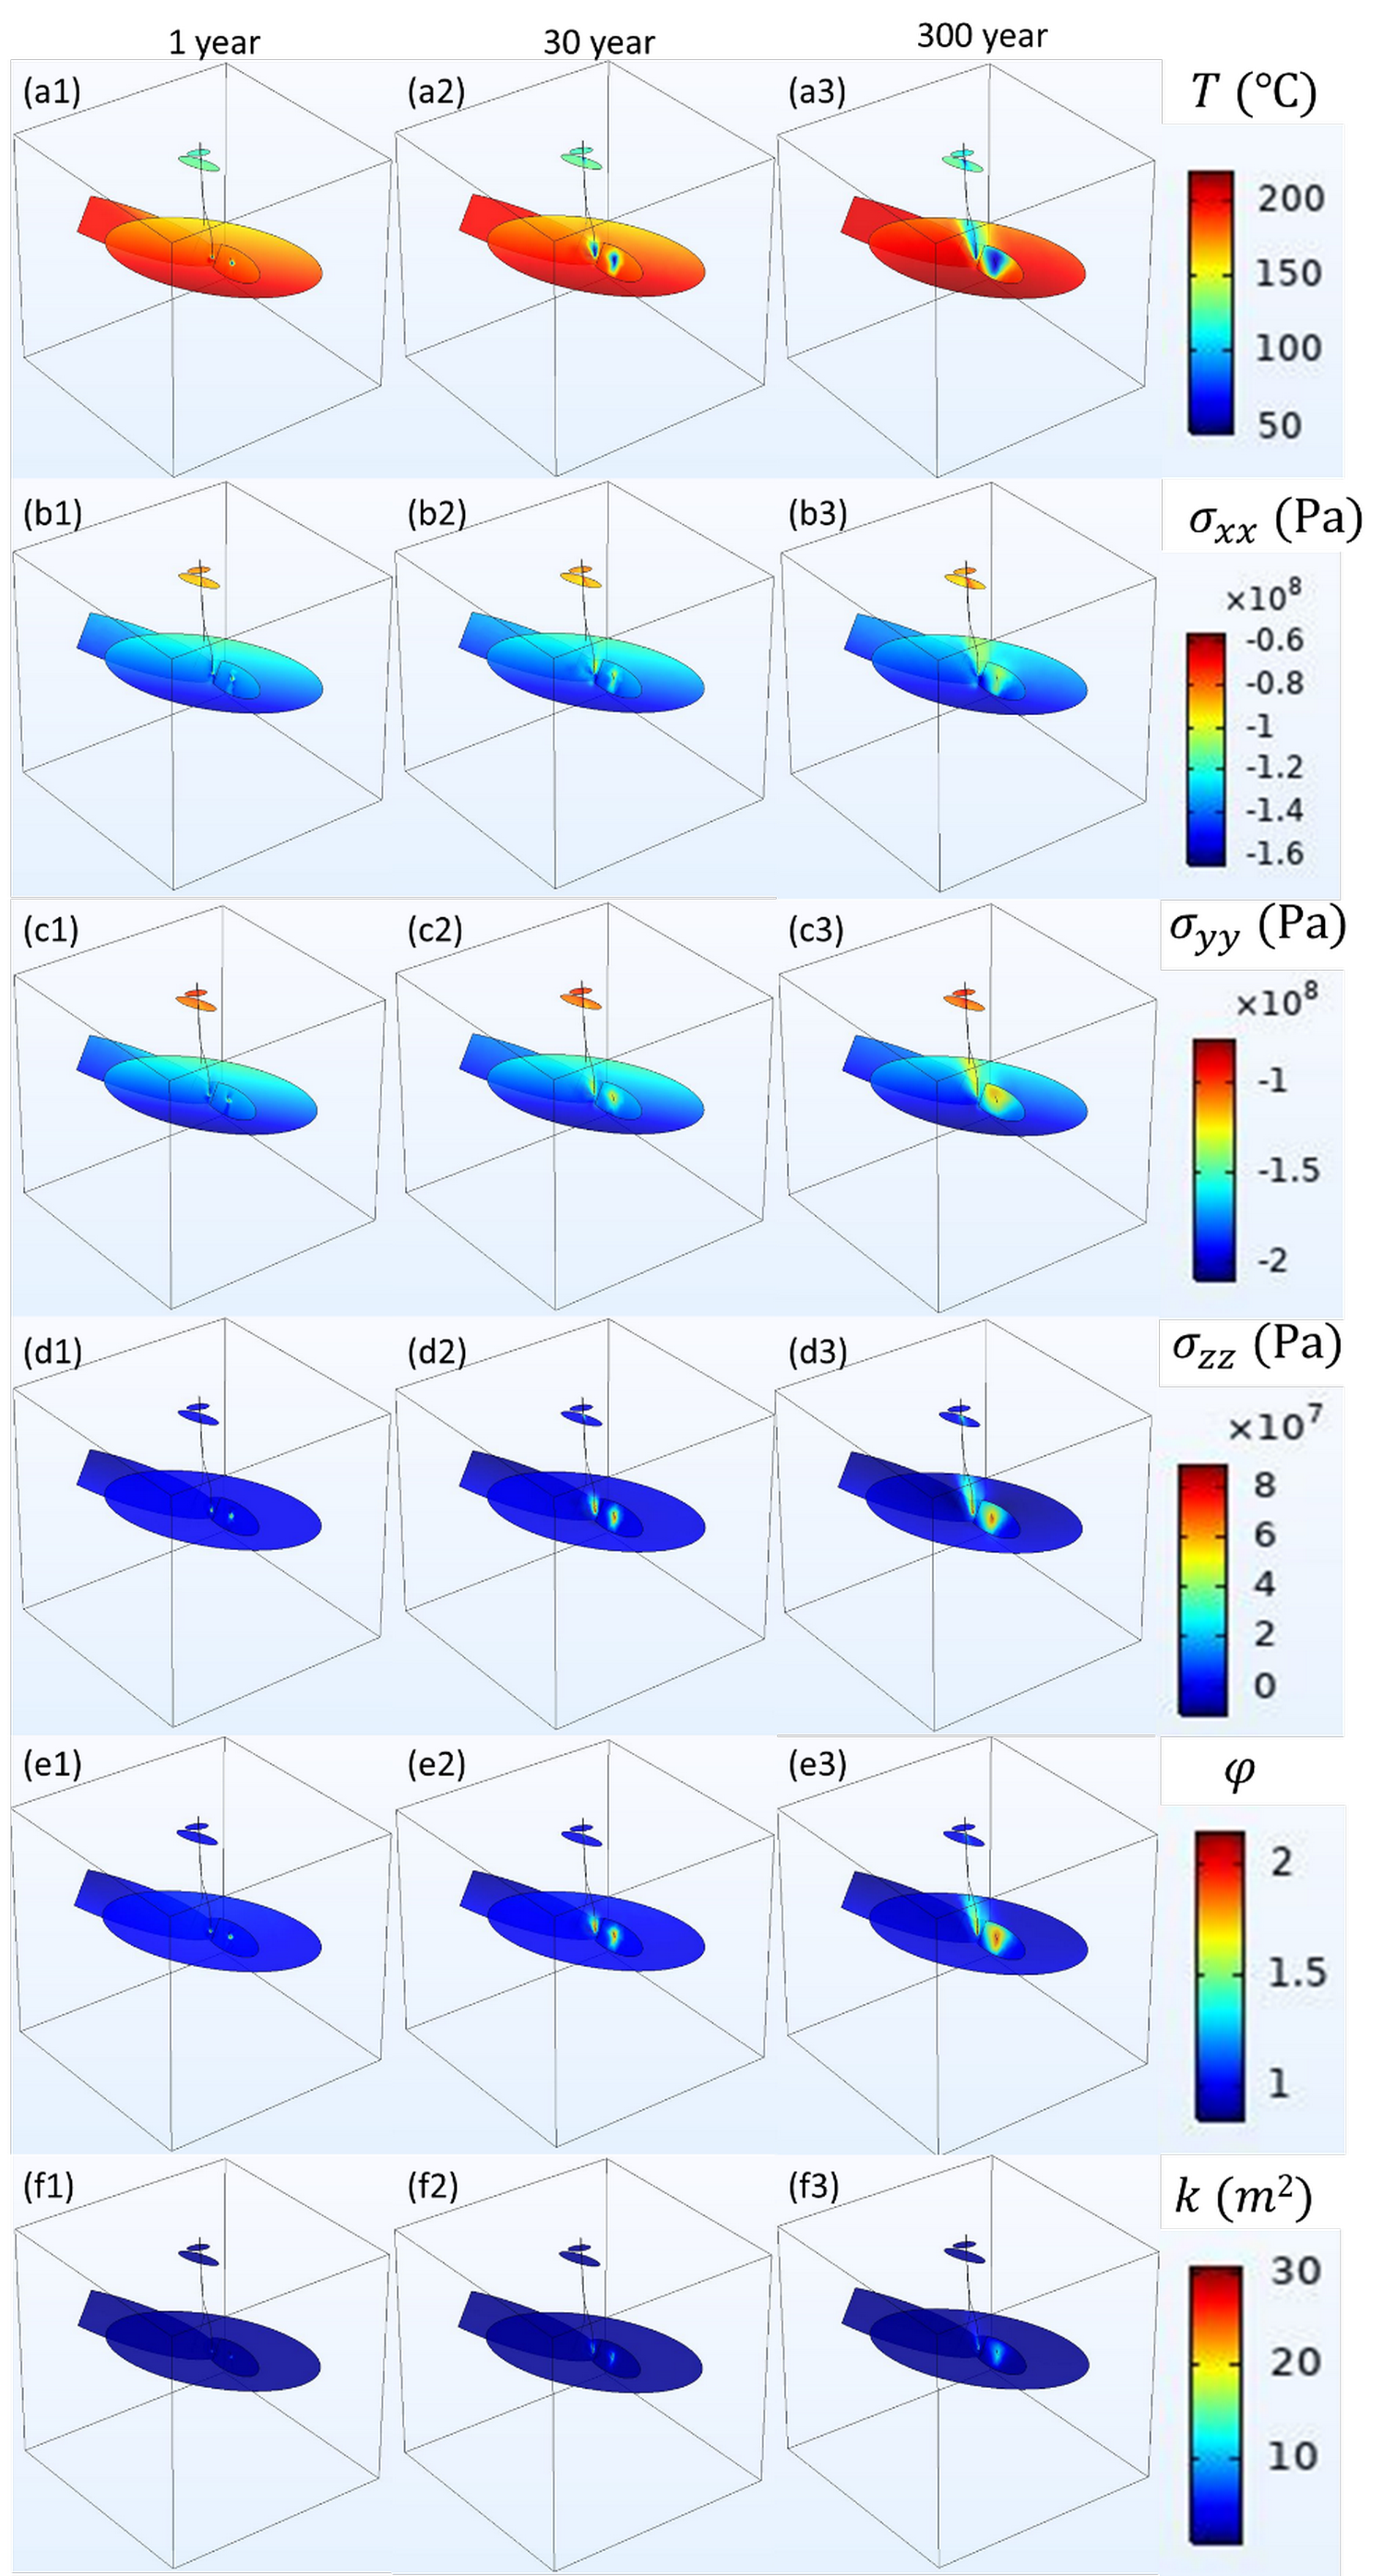
Figure 1: Thermo-Hydro-Mechanical results for the base case scenario where a is 0.5 and c is 1.5. The left column indicates simulation results after one-year, middle column shows results after 30 years and the right column shows results after 300 years for (a1-a3) temperature, (b1-b3) principle stress in x-direction, (c1-c3) principle stress in y-direction, (d1-d3) principle stress in z-direction, (e1-e3) porosity changes ratio compared to the initial values and (f1-f3) permeability changes ratio compared to the initial values.