Caption
Figure 1: Typical turbulence structure, represented through visualisation of Q-criteria: (U)RANS models (top), and ER-models (bottom).
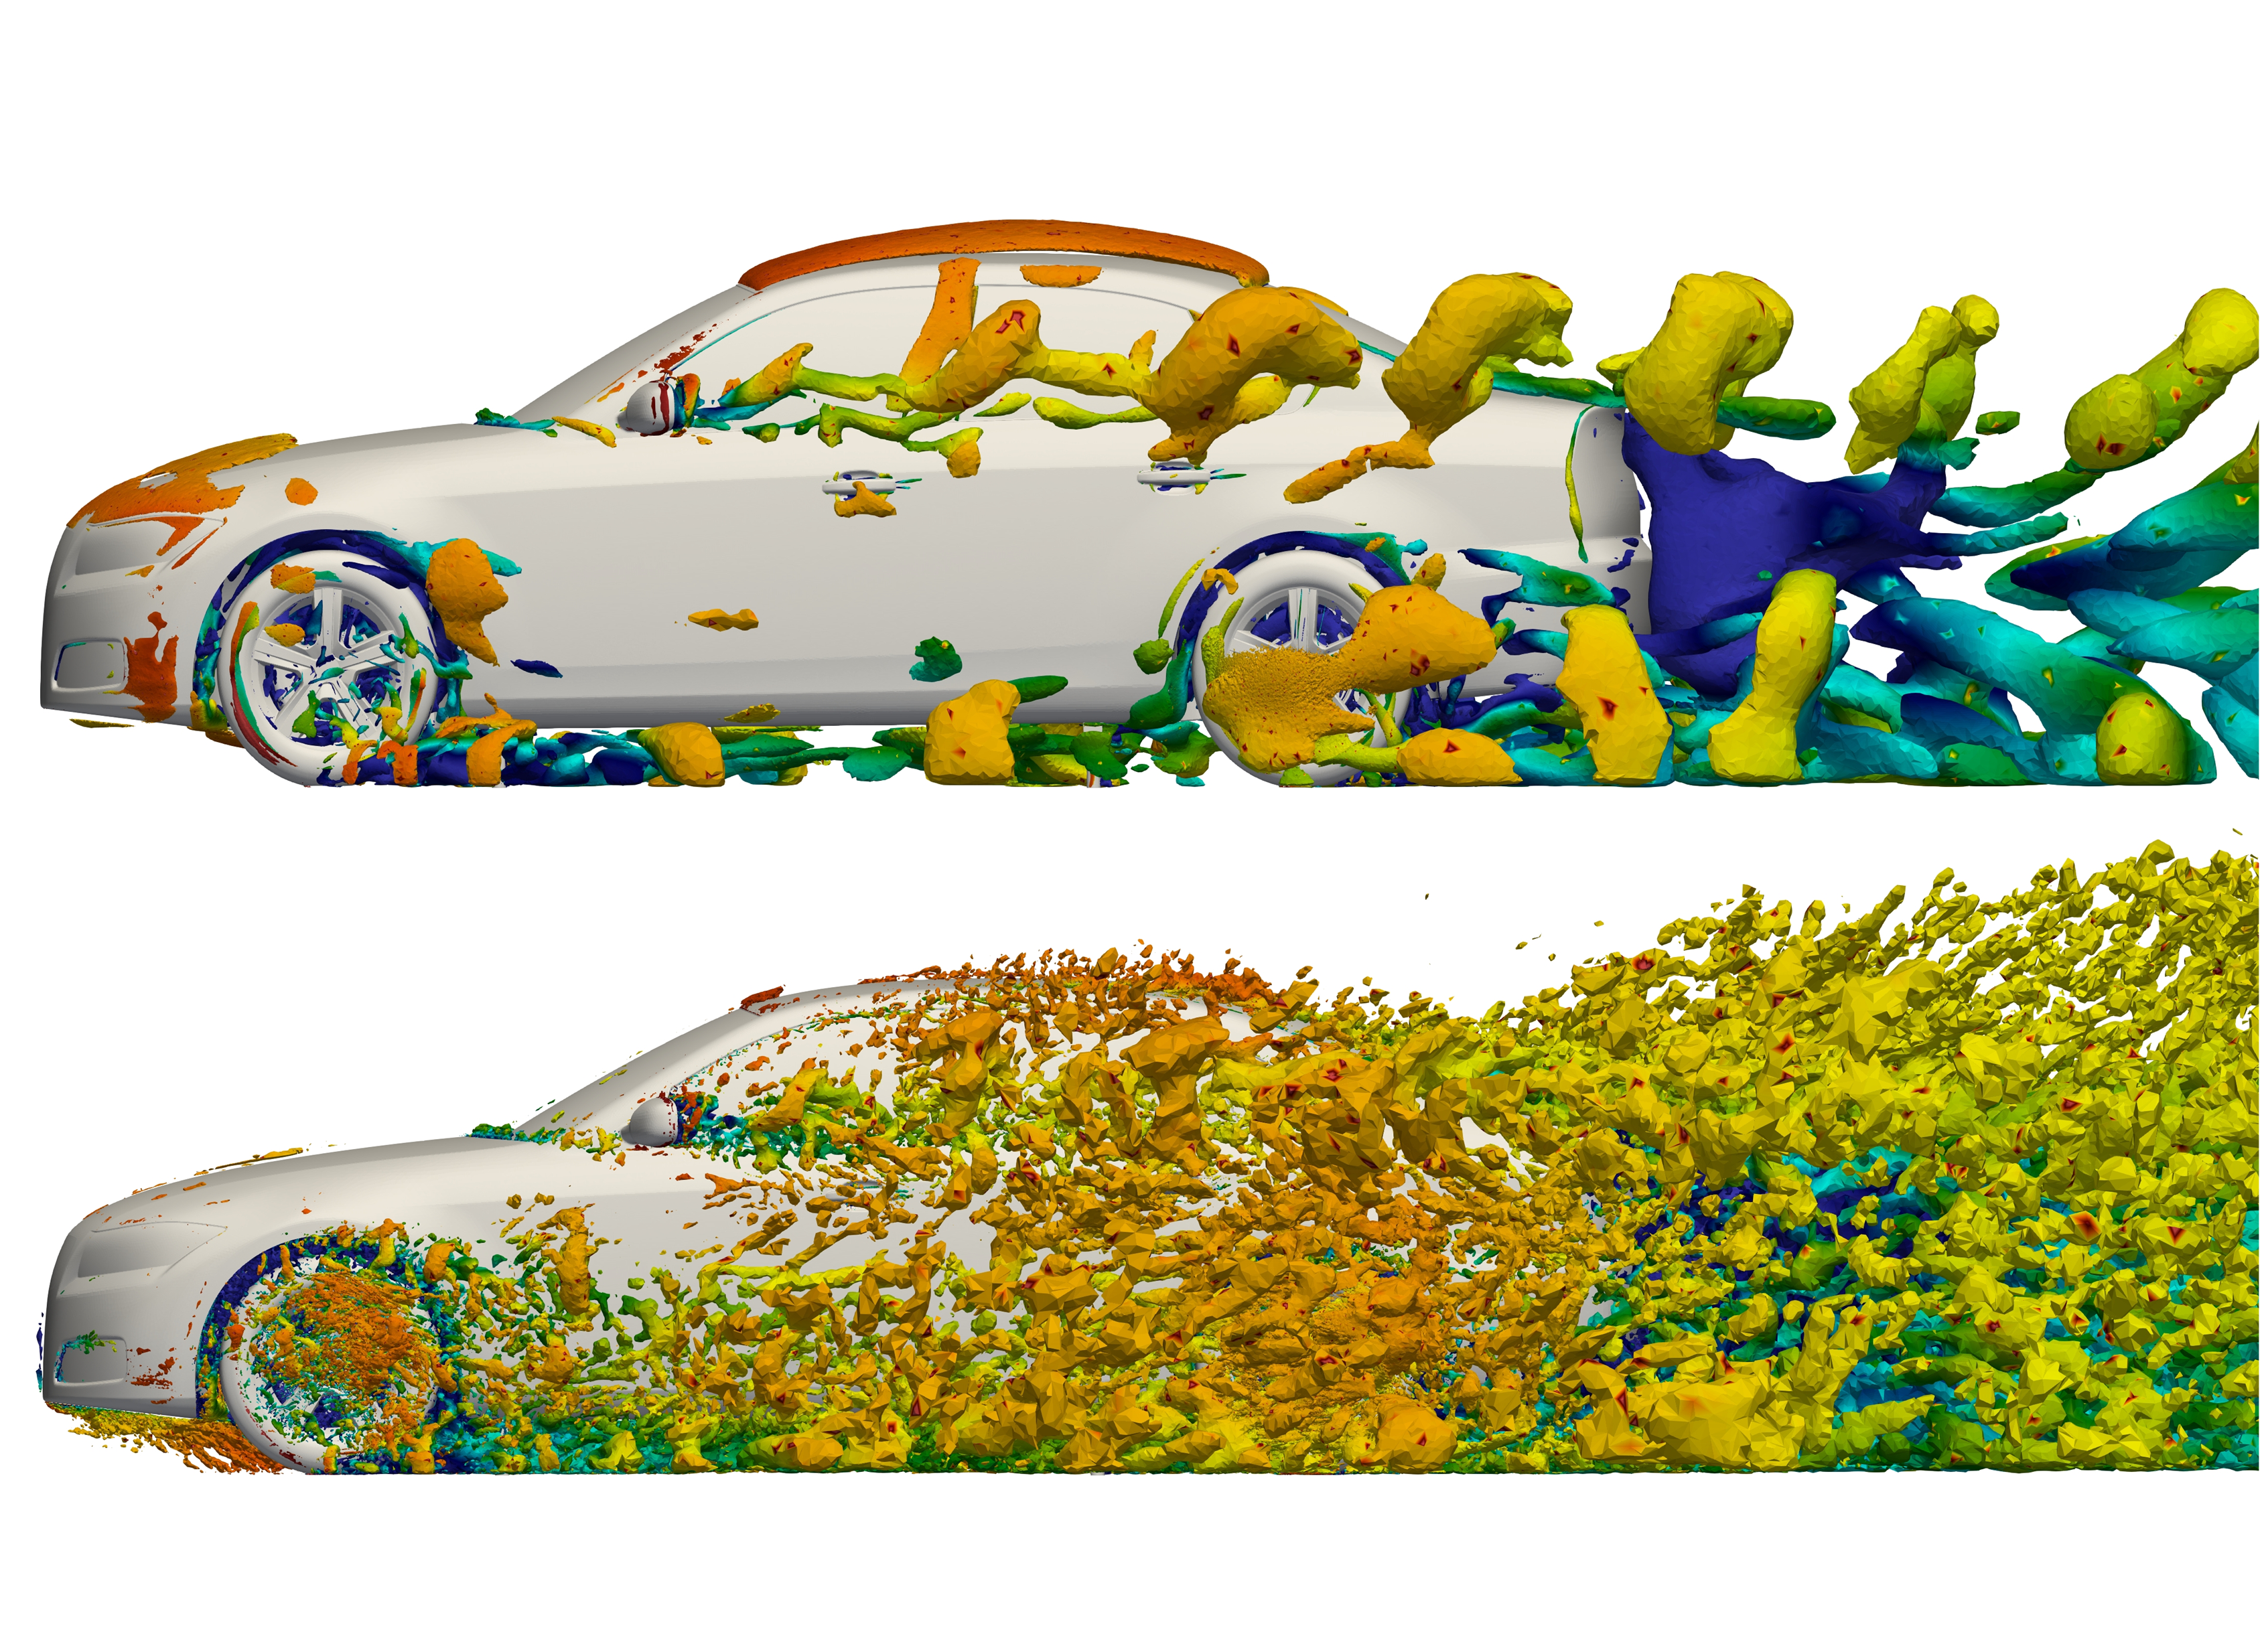
Figure 1: Typical turbulence structure, represented through visualisation of Q-criteria: (U)RANS models (top), and ER-models (bottom).