Caption
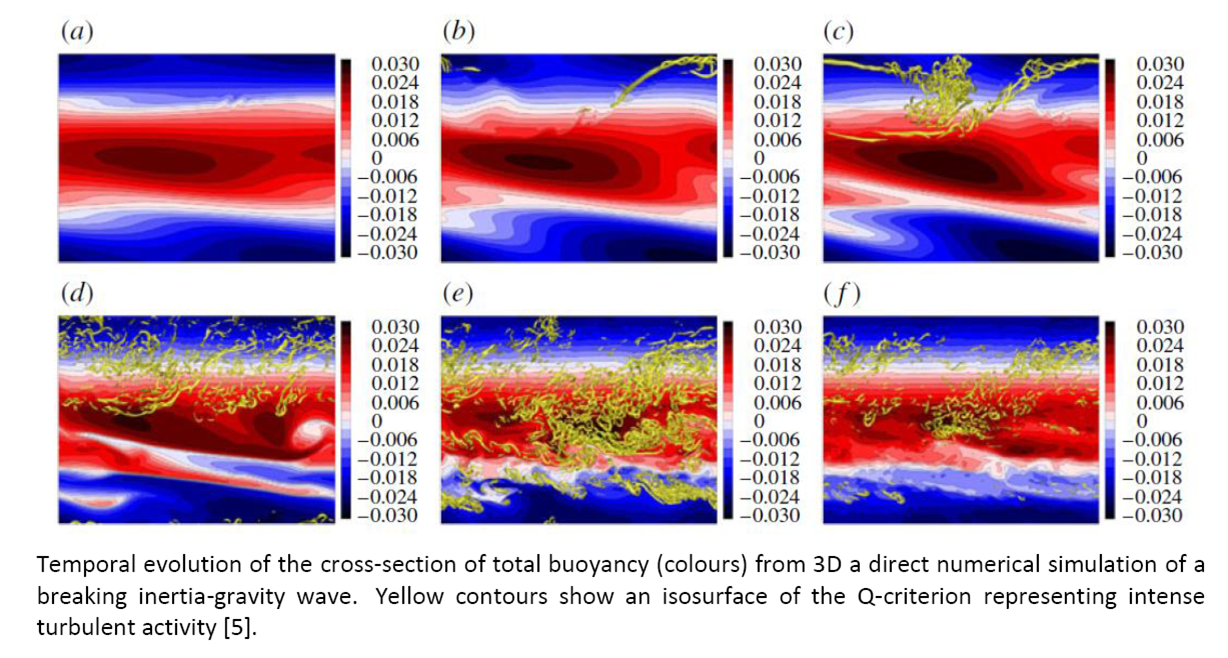
Figure: Temporal evolution of the cross-section of total buoyancy (colors) from 3D a direct numerical simulation of a breaking inertia-gravity wave. Yellow contours show an isosurface of the Q-criterion representing intense turbulent activity [5].