Caption
Figure 1: Contour plot of gas phase oxygen for a two-dimensional array of particles for stoichiometric conditions. Red, green and blue lines mark temperatures close to ignition, thermal runaway and particle surface temperatures.
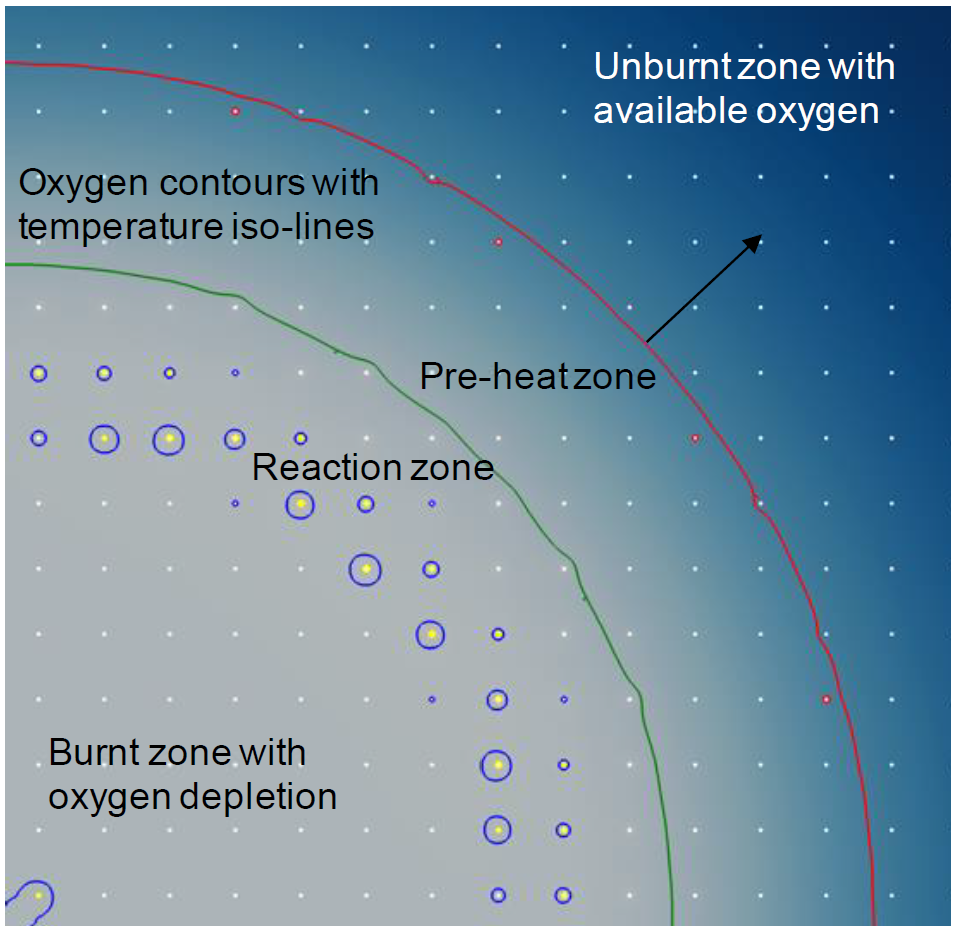
Figure 1: Contour plot of gas phase oxygen for a two-dimensional array of particles for stoichiometric conditions. Red, green and blue lines mark temperatures close to ignition, thermal runaway and particle surface temperatures.