Caption
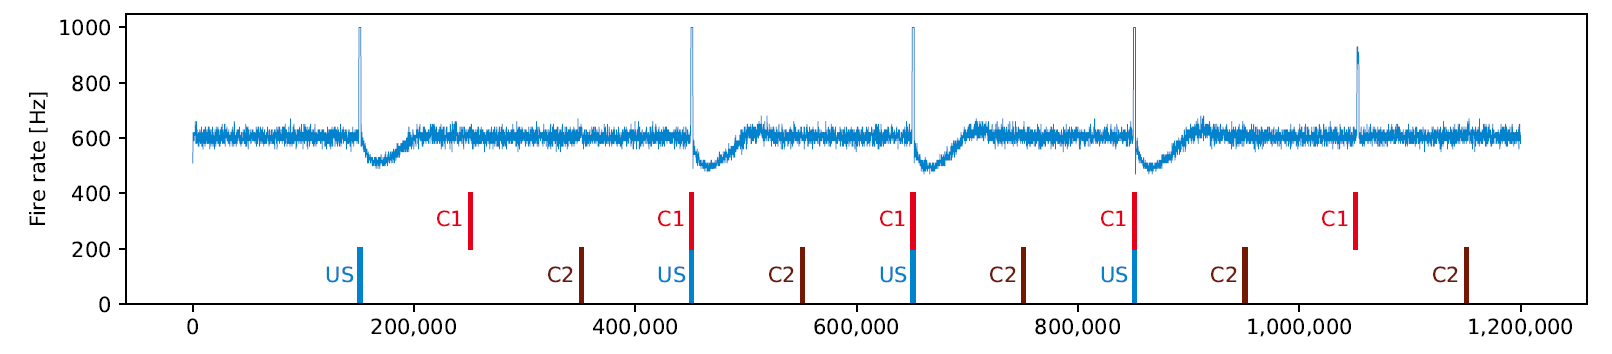
Figure 1: This picture shows the response of a memory engram “US” as a blue line (higher frequency indicated a higher response). There are three distinct populations of neurons: “US”, “C1”, and “C2”. Stimulations of a population are indicated with bars beneath the response. This experiment shows that with three simultaneous stimulations of “US” and “C1,” we can learn an association between them (shown by the last spike when only “C1” is stimulated).