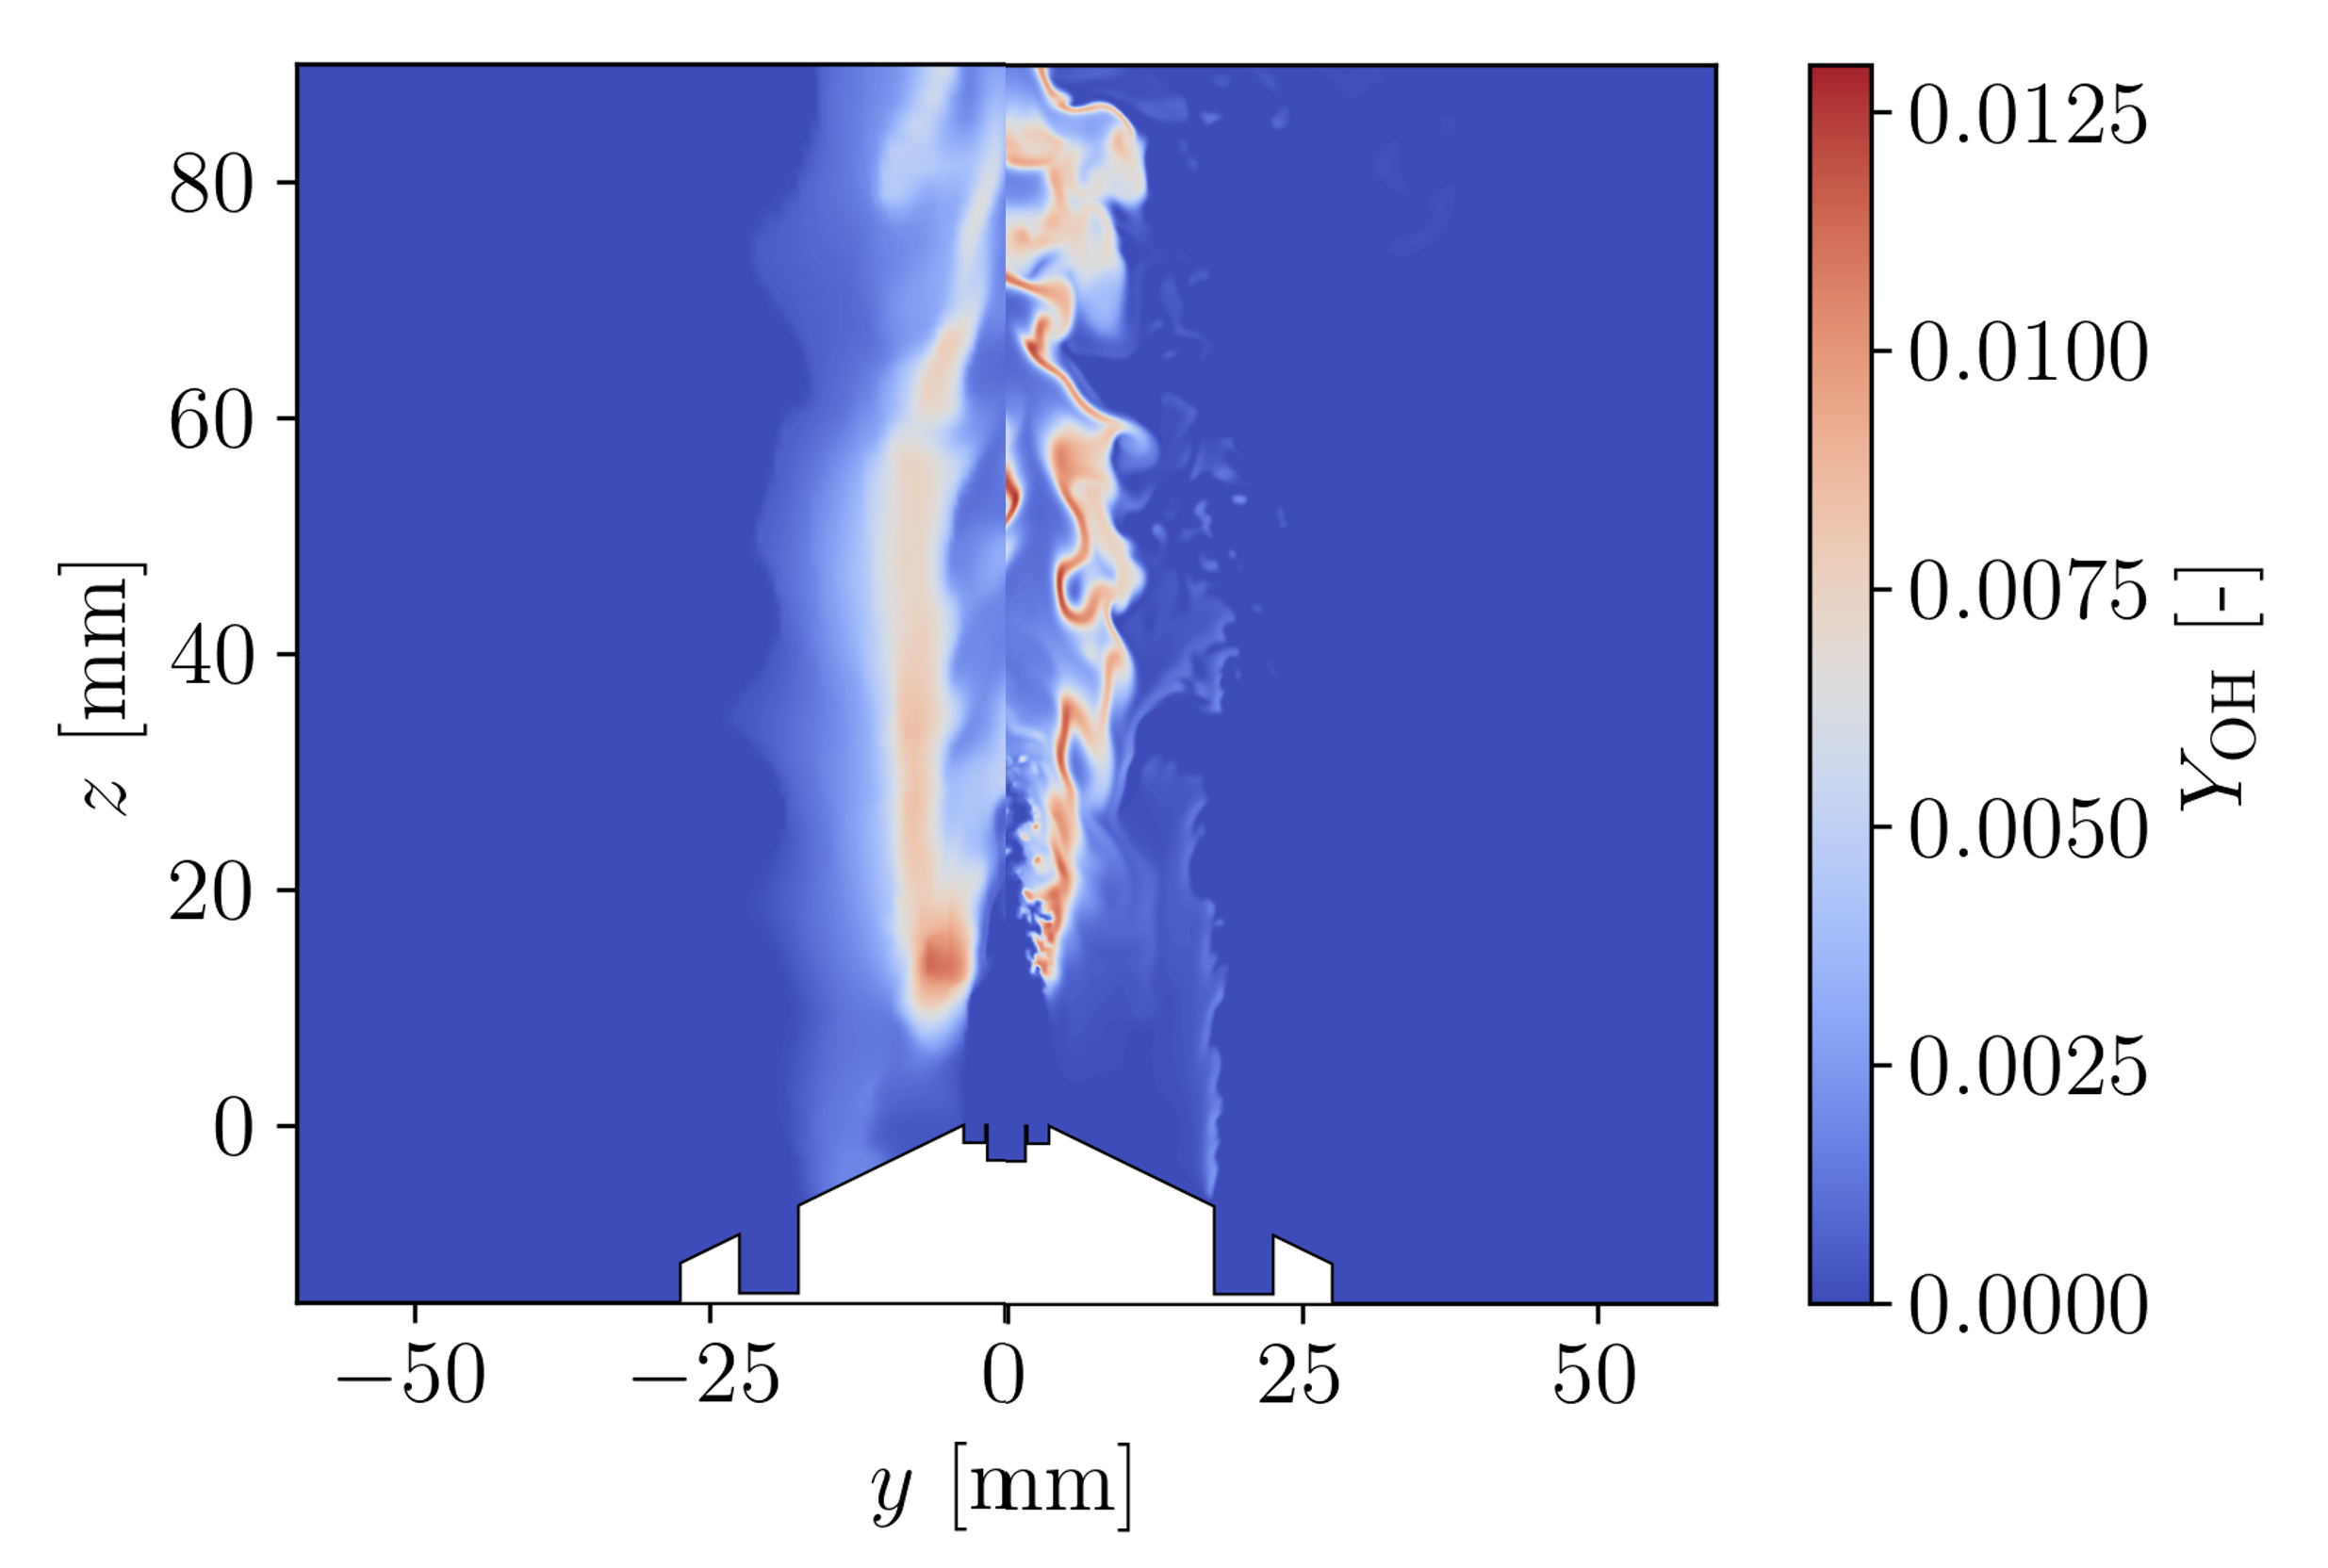
Figure 4: Comparison of instantaneous OH mass fraction of coarse LES (1.25M cells, left) and DNS (right).