Caption
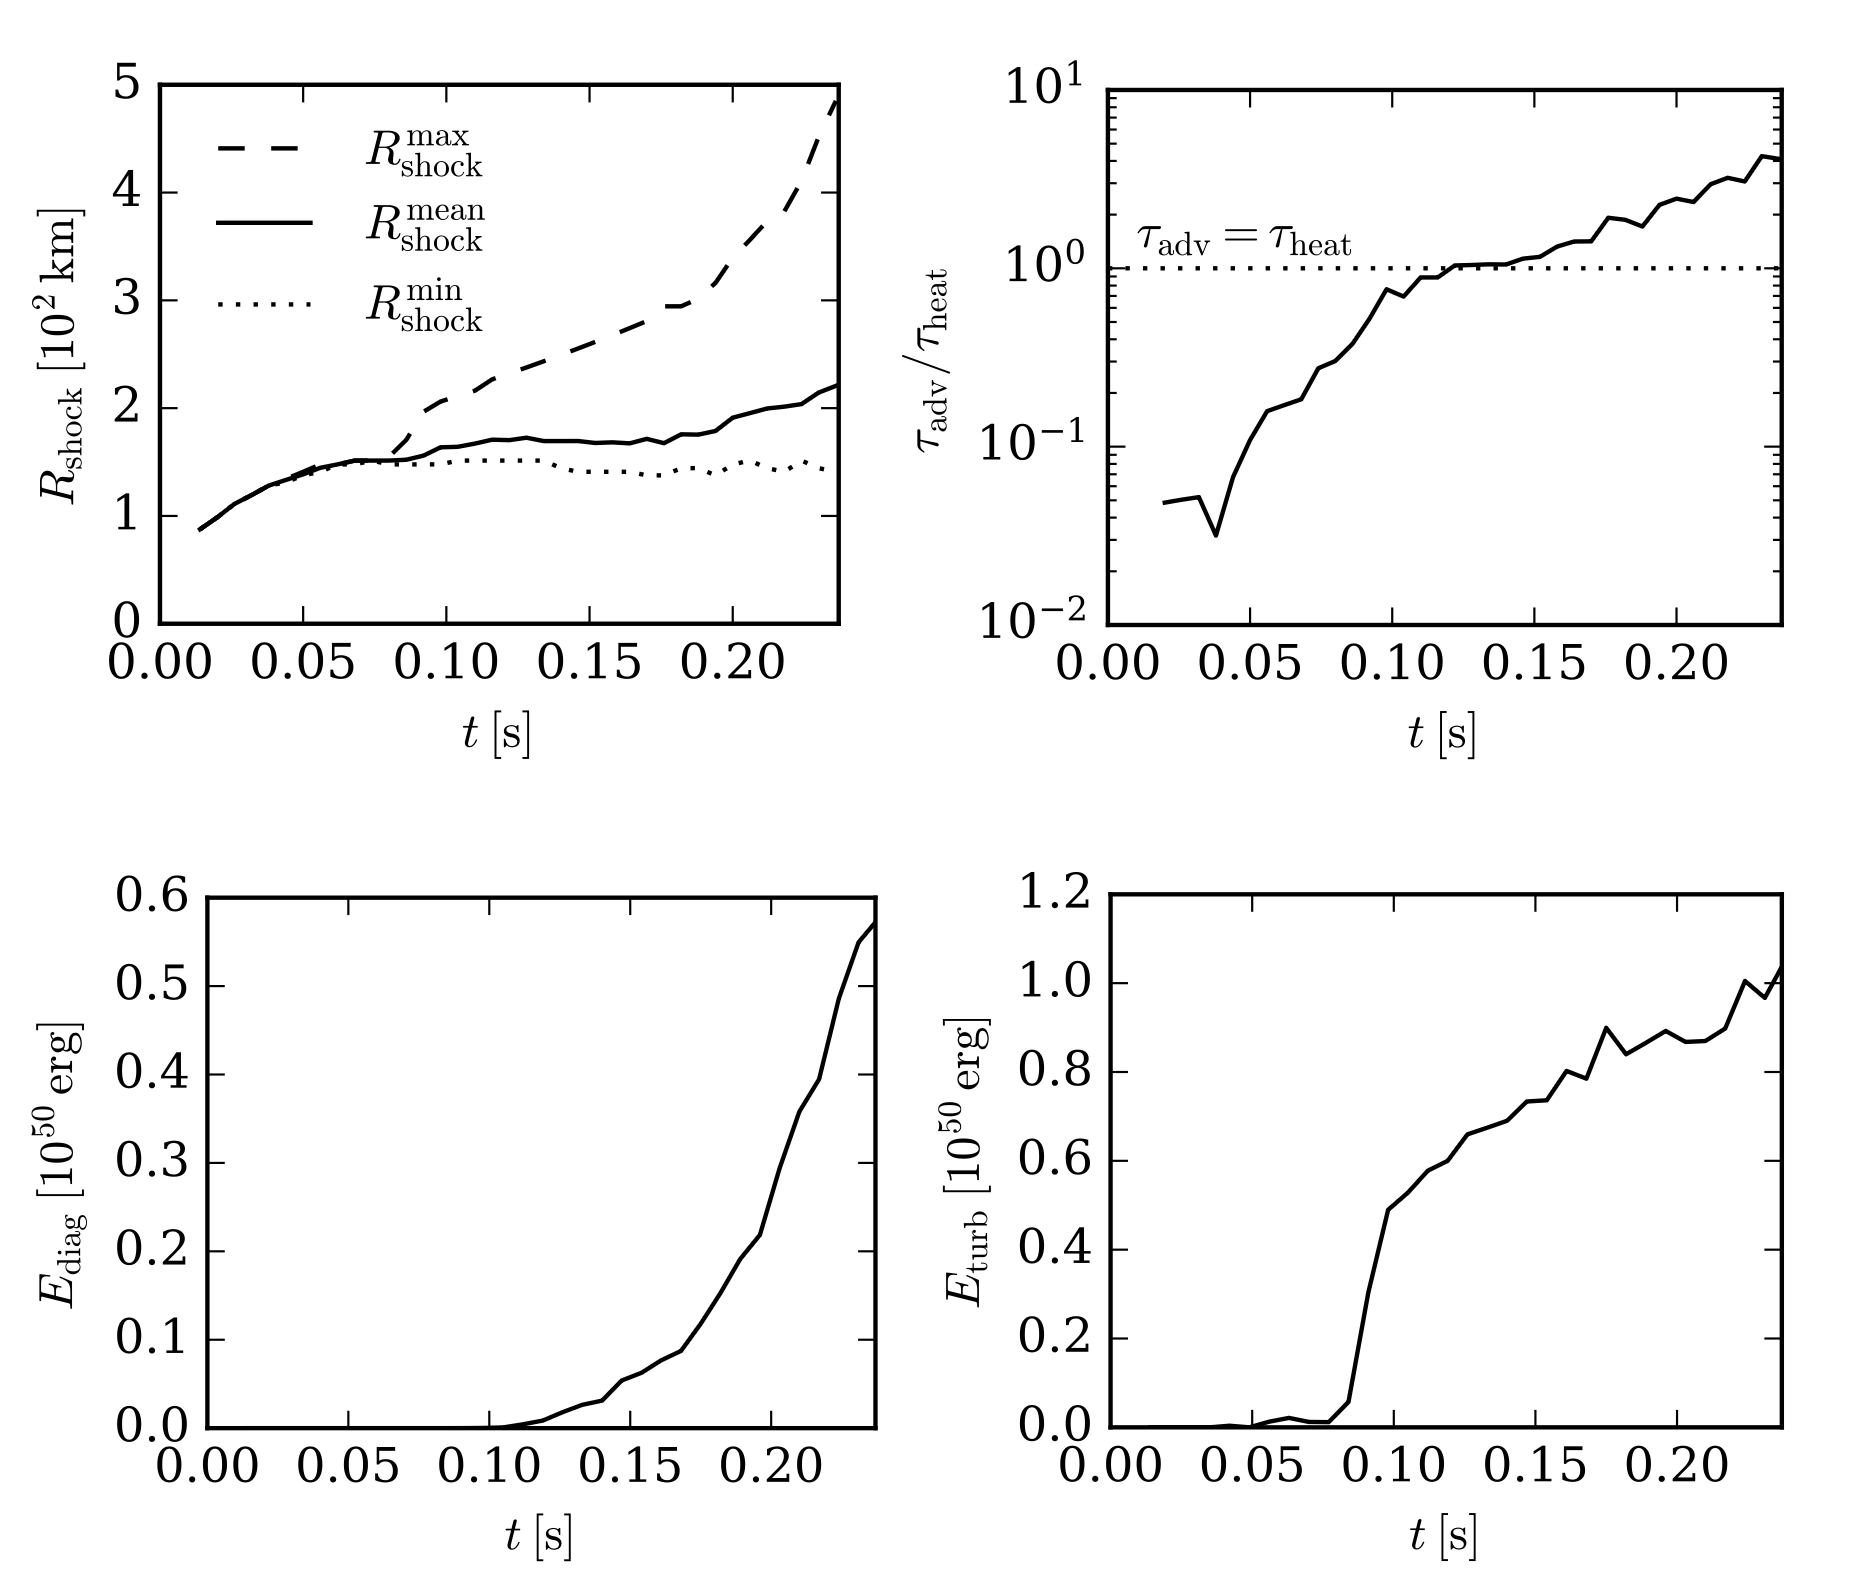
Figure 1: Top left panel shows the maximum (dashed), average (solid), and minimum (dotted) position of the shock. Top right panel displays the ratio of advection over heating timescales in the gain layer. Middle panels show the diagnostic (left) and turbulent (right) energy.