Caption
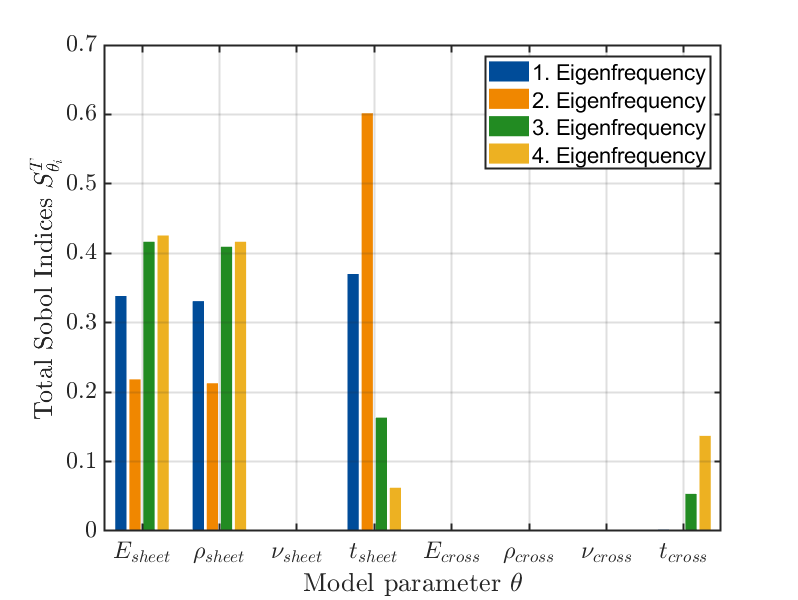
Figure1: Result of sensitivity analysis. The horizontal axis shows the model parameters, while the vertical axis denotes the total Sobol Indices of parameters regarding 4 quantities of interests. Young’s Modulus Esheet, density ρsheet, and thickness tsheet are sensitive to 4 Eigenfrequencies due to higher total Sobol Indices.