Caption
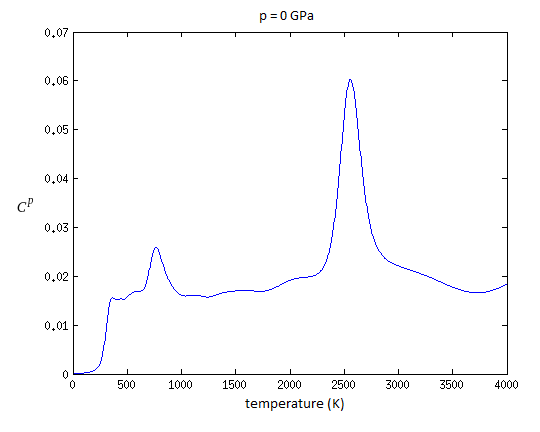
Figure 1: Specific heat plotted against the temperature for the Müller-Albe iron potential with a Nested Sampling run with 60 atoms and 4800 walkers. The peaks resemble the transition points with the melting point at about 2500K and a solid-solid phase transition at about 800K. At about 300K the run was stopped, which causes the calculated specific heat to drop to zero at this point.