Caption
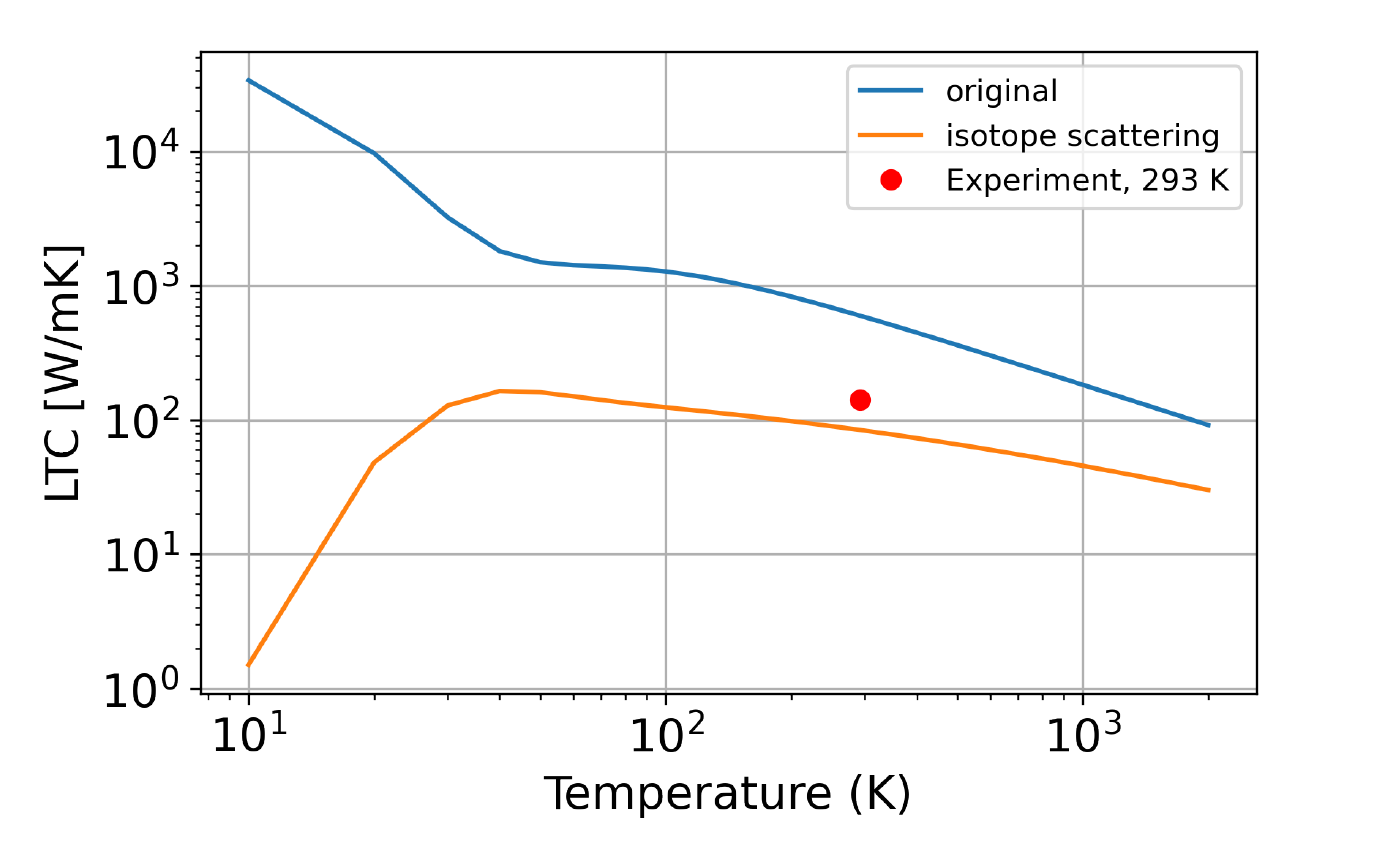
Figure 1: Temperature dependent lattice thermal conductivity (LTC) of bcc molybdenum. The blue graph shows the LTC and diverges for T !0 since only phonon-phonon interactions are considered. The yellow graph shows the LTC when isotope scattering is introduced. The red dot shows the experimental value at 293 K.