Caption
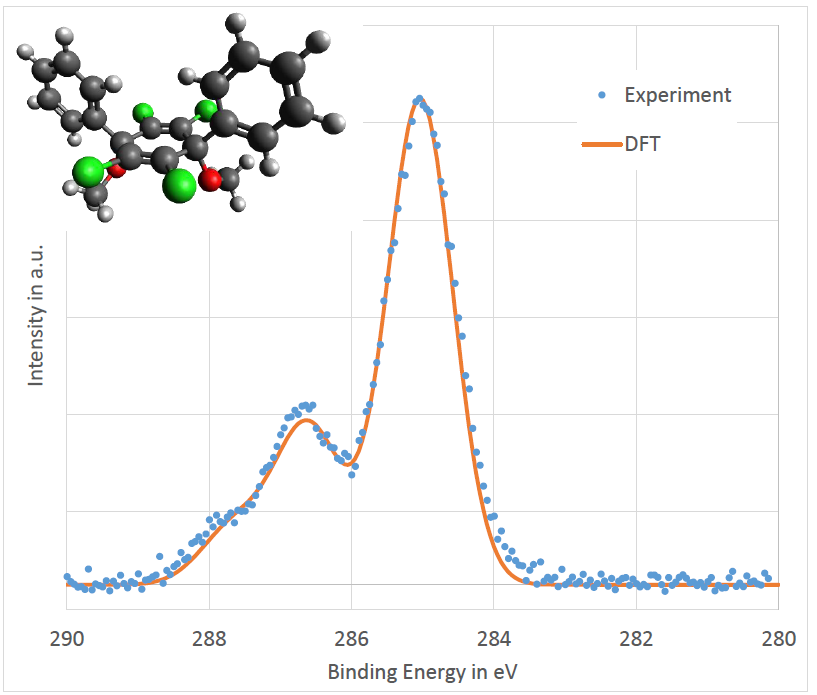
Figure 1. Comparison of the carbon 1s orbital emission spectrum obtained from photoelectron spectroscopy measurements and DFT calculations. The structure of the studied molecule is shown in the left top corner (C – dark grey, H – light grey, Cl – green, O - red).