Computer-Aided Analysis of Time-Lapse Microscopy Data I
 Alexander Löwer_Computer-Aided Analysis of Time-Lapse Microscopy Data_Figure1
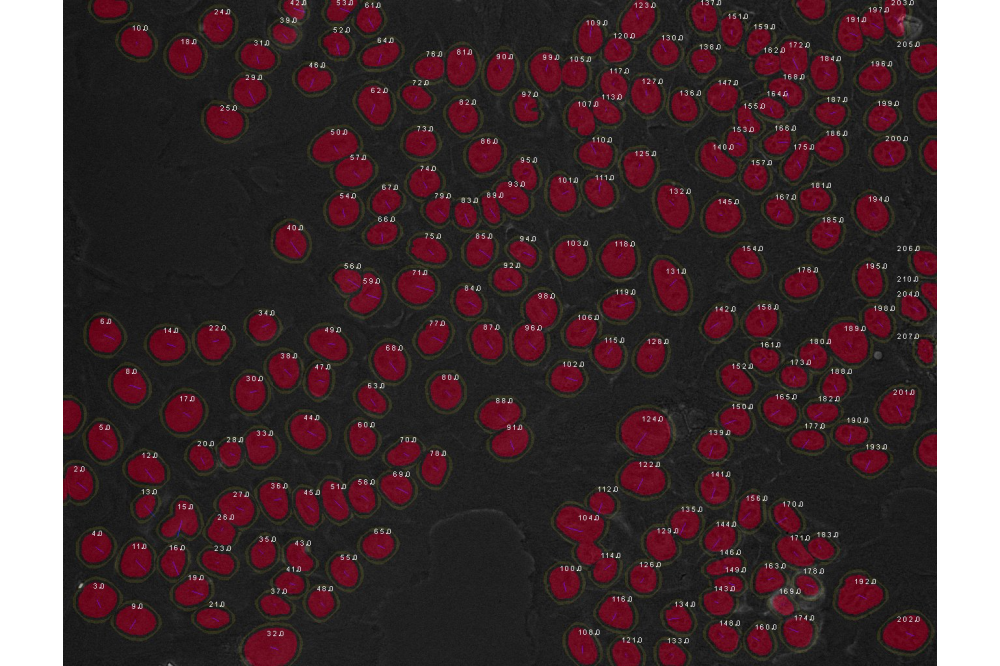
Figure 1: Image segmentation and object identification of human breast epithelial cells.
Alexander LöwerEinleitung
During development and adult homeostasis, cells in our bodies need to constantly integrate internal and external information to adjust their physiology and chose appropriate cell fates. To understand cellular signal processing, we need to reveal how the underlying molecular networks function dynamically in individual living cells. Live-cell time-lapse microscopy in combination with fluorescent reporter cell lines allows to follow molecular processes with unrivaled temporal and spatial resolution and provides the necessary quantitative data to gain a mechanistic understanding of cellular signaling. However, to quantify the resulting large data sets on the single cell level, sophisticated image analysis algorithms are required. To allow timely data-analysis, computer-aided segmentation, object tracking and classification is scaled to the parallel computing infrastructure of the Lichtenberg cluster.
Methoden
Using automated fluorescent microscopy, we acquire high-resolution images of reporter cell lines from 60 – 300 field of views in up to four channels for periods of 24 – 96h with a time resolution of 3 - 20min. Individual cells are tracked throughout the duration of the experiment using custom-written Matlab scripts. In brief, we first apply flat field correction and background subtraction to raw images before segmenting individual nuclei from nuclear marker images
using adaptive thresholding and seeded watershed algorithms. Segmented objects are then assigned to corresponding objects in following images using point set registration and a greedy match algorithm. We finally track cells in forward or backward direction from the first to the last time point and quantify various features of the fluorescence signals. This typically results in ten thousand of single cell trajectories for each experiment.
Ergebnisse
We first migrated our image analysis framework to the Lichtenberg Cluster by developing Matlab scripts that allow to access cluster resources directly from Matlab instances running on local workstations. In addition, we established corresponding protocols for data transfer to the file systems of the cluster. We tested our setup with several pilot runs using data sets with variable sizes. The results indicated that the different steps of the pipeline could be efficiently parallelized and scaled well even on large data sets. After optimizing wall times and memory usage, we started to routinely use the Lichtenberg Cluster for data analysis in the context of ongoing research projects. For example, we used cluster resources to systematically investigate how ligands of the TGFβ family, which are involved in development and human diseases, activate their corresponding signaling pathway in quiescent and proliferating breast epithelial cells. We could show that the diversity of SMAD-mediated responses is mediated by differing cellular states, which determine ligand sensitivity and phenotypic effects, while the pathway itself merely serves as relay from the cell membrane to the nucleus. The results provide important insights into the hierarchical interplay of pro- and anti-proliferative signaling
in tissue homeostasis, and may be exploited to improve current therapeutic approaches for cancer.
Diskussion
Migrating the image analysis framework from individual workstations to the Lichtenberg Cluster reduced the duration of analysis from several days to about 12h and allowed us to significantly expand the scope of our experiments.