Phase Diagram Calculations for Interatomic Potentials
 Helzel, Aron_Phase diagram calculations for interatomic potentials
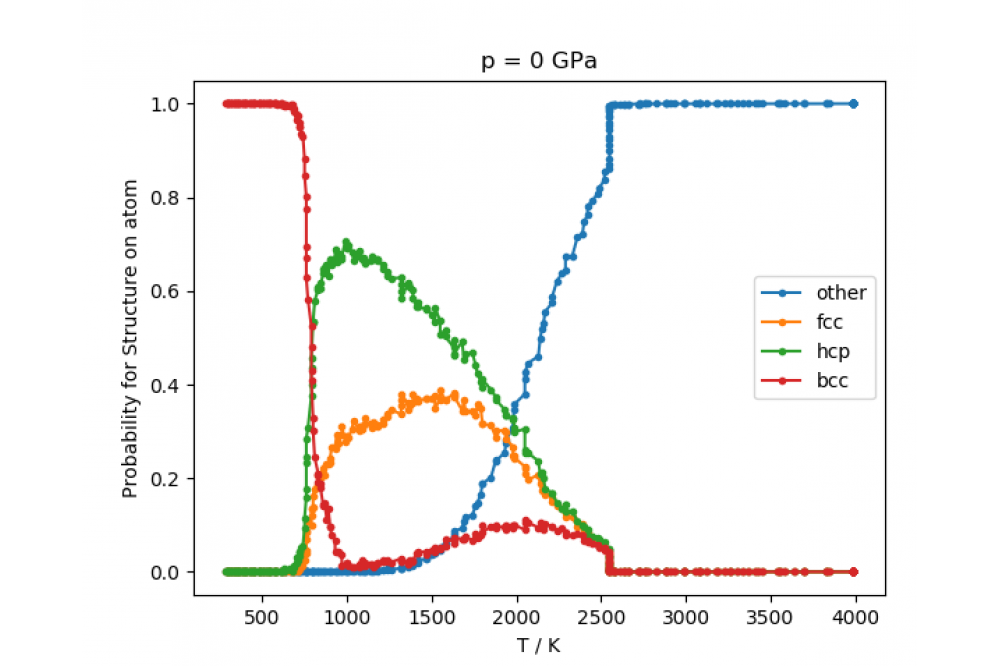
Figure 1: Probabilities for structures at different temperatures for the Müller-Albe bond-order
potential of iron at zero pressure. At low temperatures the bcc structure is dominant as in real
iron. For higher temperatures the hcp structure, that is normally present at high pressures is
dominant instead of the correct fcc structure. At a bit more than 2500 K the melting point is
reached and no solid structures are found anymore.
Einleitung
Understanding the behavior of different materials not only furthers general knowledge, but can also often be used for practical purposes in e.g. engineering. Computer Simulations, where these materials are simulated as small atoms, that exert forces on each other, play an important role in this field and there are already many applications for many different materials. Since these simulations cannot describe the behavior of the materials without approximations and simplifications, it is always important to assess their error and compare results with experiments, where this is possible. One of the properties, that can be compared, are phase transitions, which are changes in the structure of the material, that happen at certain temperatures, pressures and compositions of the material. In this project one of the methods for calculating transition points was tested and investigated on its strengths and weaknesses. For this test calculations were necessary and in the end a systematic search for the transition temperatures at different pressures for iron with one specific potential, from which the forces are calculated (Müller-Albe bondorder potential), was done. Since such calculations are quiet costly, it was necessary to use a High Performance Computer.
Methoden
The used method for calculating the transition temperatures is called Nested Sampling and was published in the open source software pymatnest. It starts with a sample of atom configurations, where the atoms are placed at random in a space of high volume, which resembles the structure of a gas. During the run of the program the configurations, that are connected with the highest temperature, are culled from the set and replaced with configurations of lower temperature. In this way configurations of lower and lower temperatures are generated. Also the speed, in that the temperature gets lower with each step of the algorithm, is connected to the specific heat of the material, which is especially high for transition temperatures. In the end plotting the specific heat against the temperature can show all transition temperatures and the calculated configurations can be used to classify the phases.
Ergebnisse
While there were some initial problems in running the program, it was possible to get it to run at similar efficiency to publications after some months. After that the right adjustment of the program settings for different situations could be learned and the more thorough usage of the method on the Müller-Albe bond-order potential was possible to make. For this the transition temperatures for four different pressures were calculated. At low pressure and low temperature the iron is in the structure, it is known to have at these values. For higher temperatures there is a transition to another phase, as is the case for real iron, but this high temperature phase is experimentally a high pressure phase, not a high temperature one. Furthermore the associated transition temperature and the melting temperature are both a few hundred Kelvin off. The Nested Sampling method itself seems to be capable to detect even unknown phase transitions and is able to scan for them for a wide range of temperatures, but has a comparatively high computation cost.
Diskussion
This work lays a necessary foundation for further work with the Nested Sampling method. On the one hand with more computation time it will be possible to calculate the transition temperatures of the Müller-Albe bond-order potential on a finer grid of pressures, which would it make possible to depict it on a phase diagram, where the transition lines are plotted on a temperature-pressure diagram. Apart from this, a main goal will be the automatization of the Nested Sampling method, so that it is simpler to use and does not need months of familiarization. For this the experience gained in this period will be very useful.