Bildunterschrift
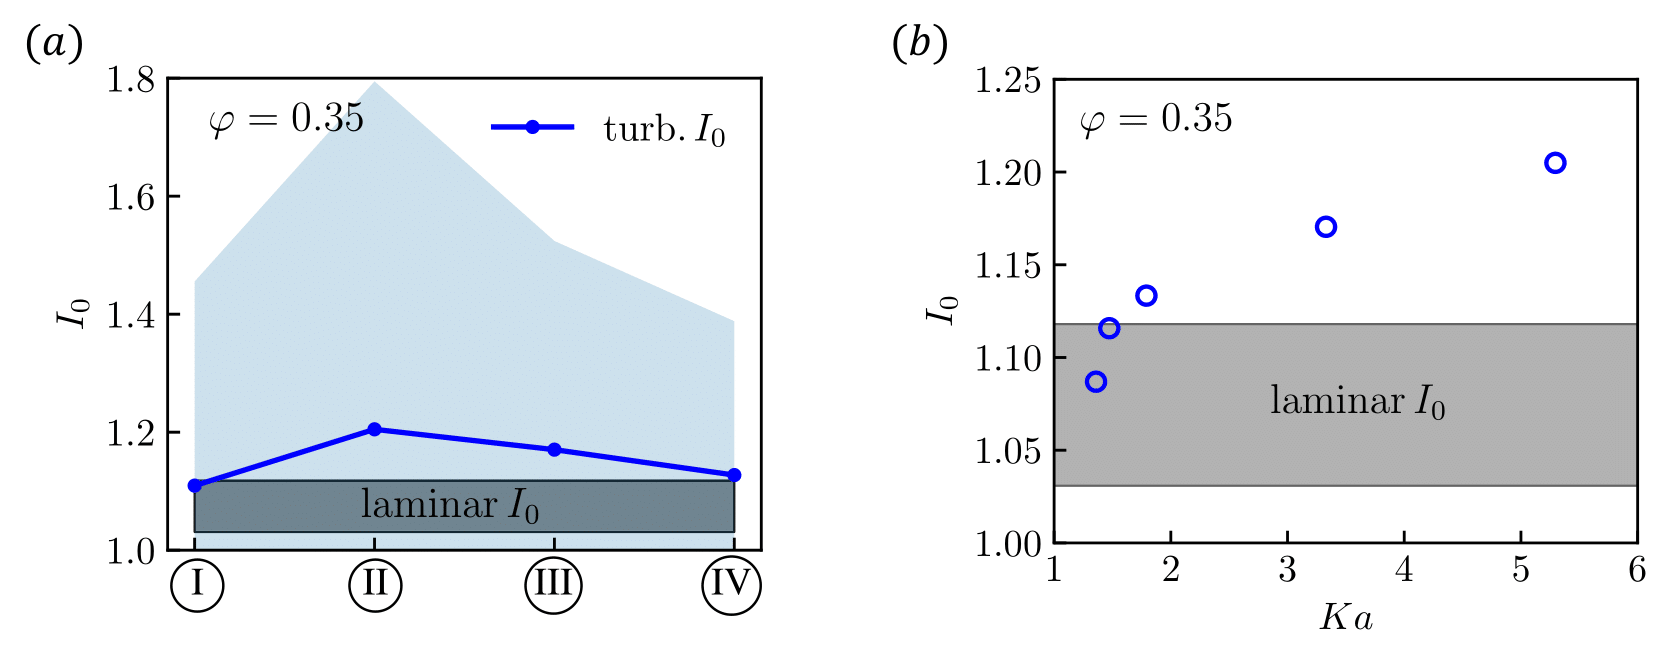
Figure 2: Averaged stretch factor I0 in bins I-IV corresponding to different wall-normal distances (a). The bin I corresponds to the near wall region, while bin IV is in the channel core. The blue corridor denotes one standard deviation. For reference, the range of I0 values for homologous laminar flames is marked by the gray shaded area. Local stretch factor I0 plotted against the local Karlovitz number (b).