Bildunterschrift
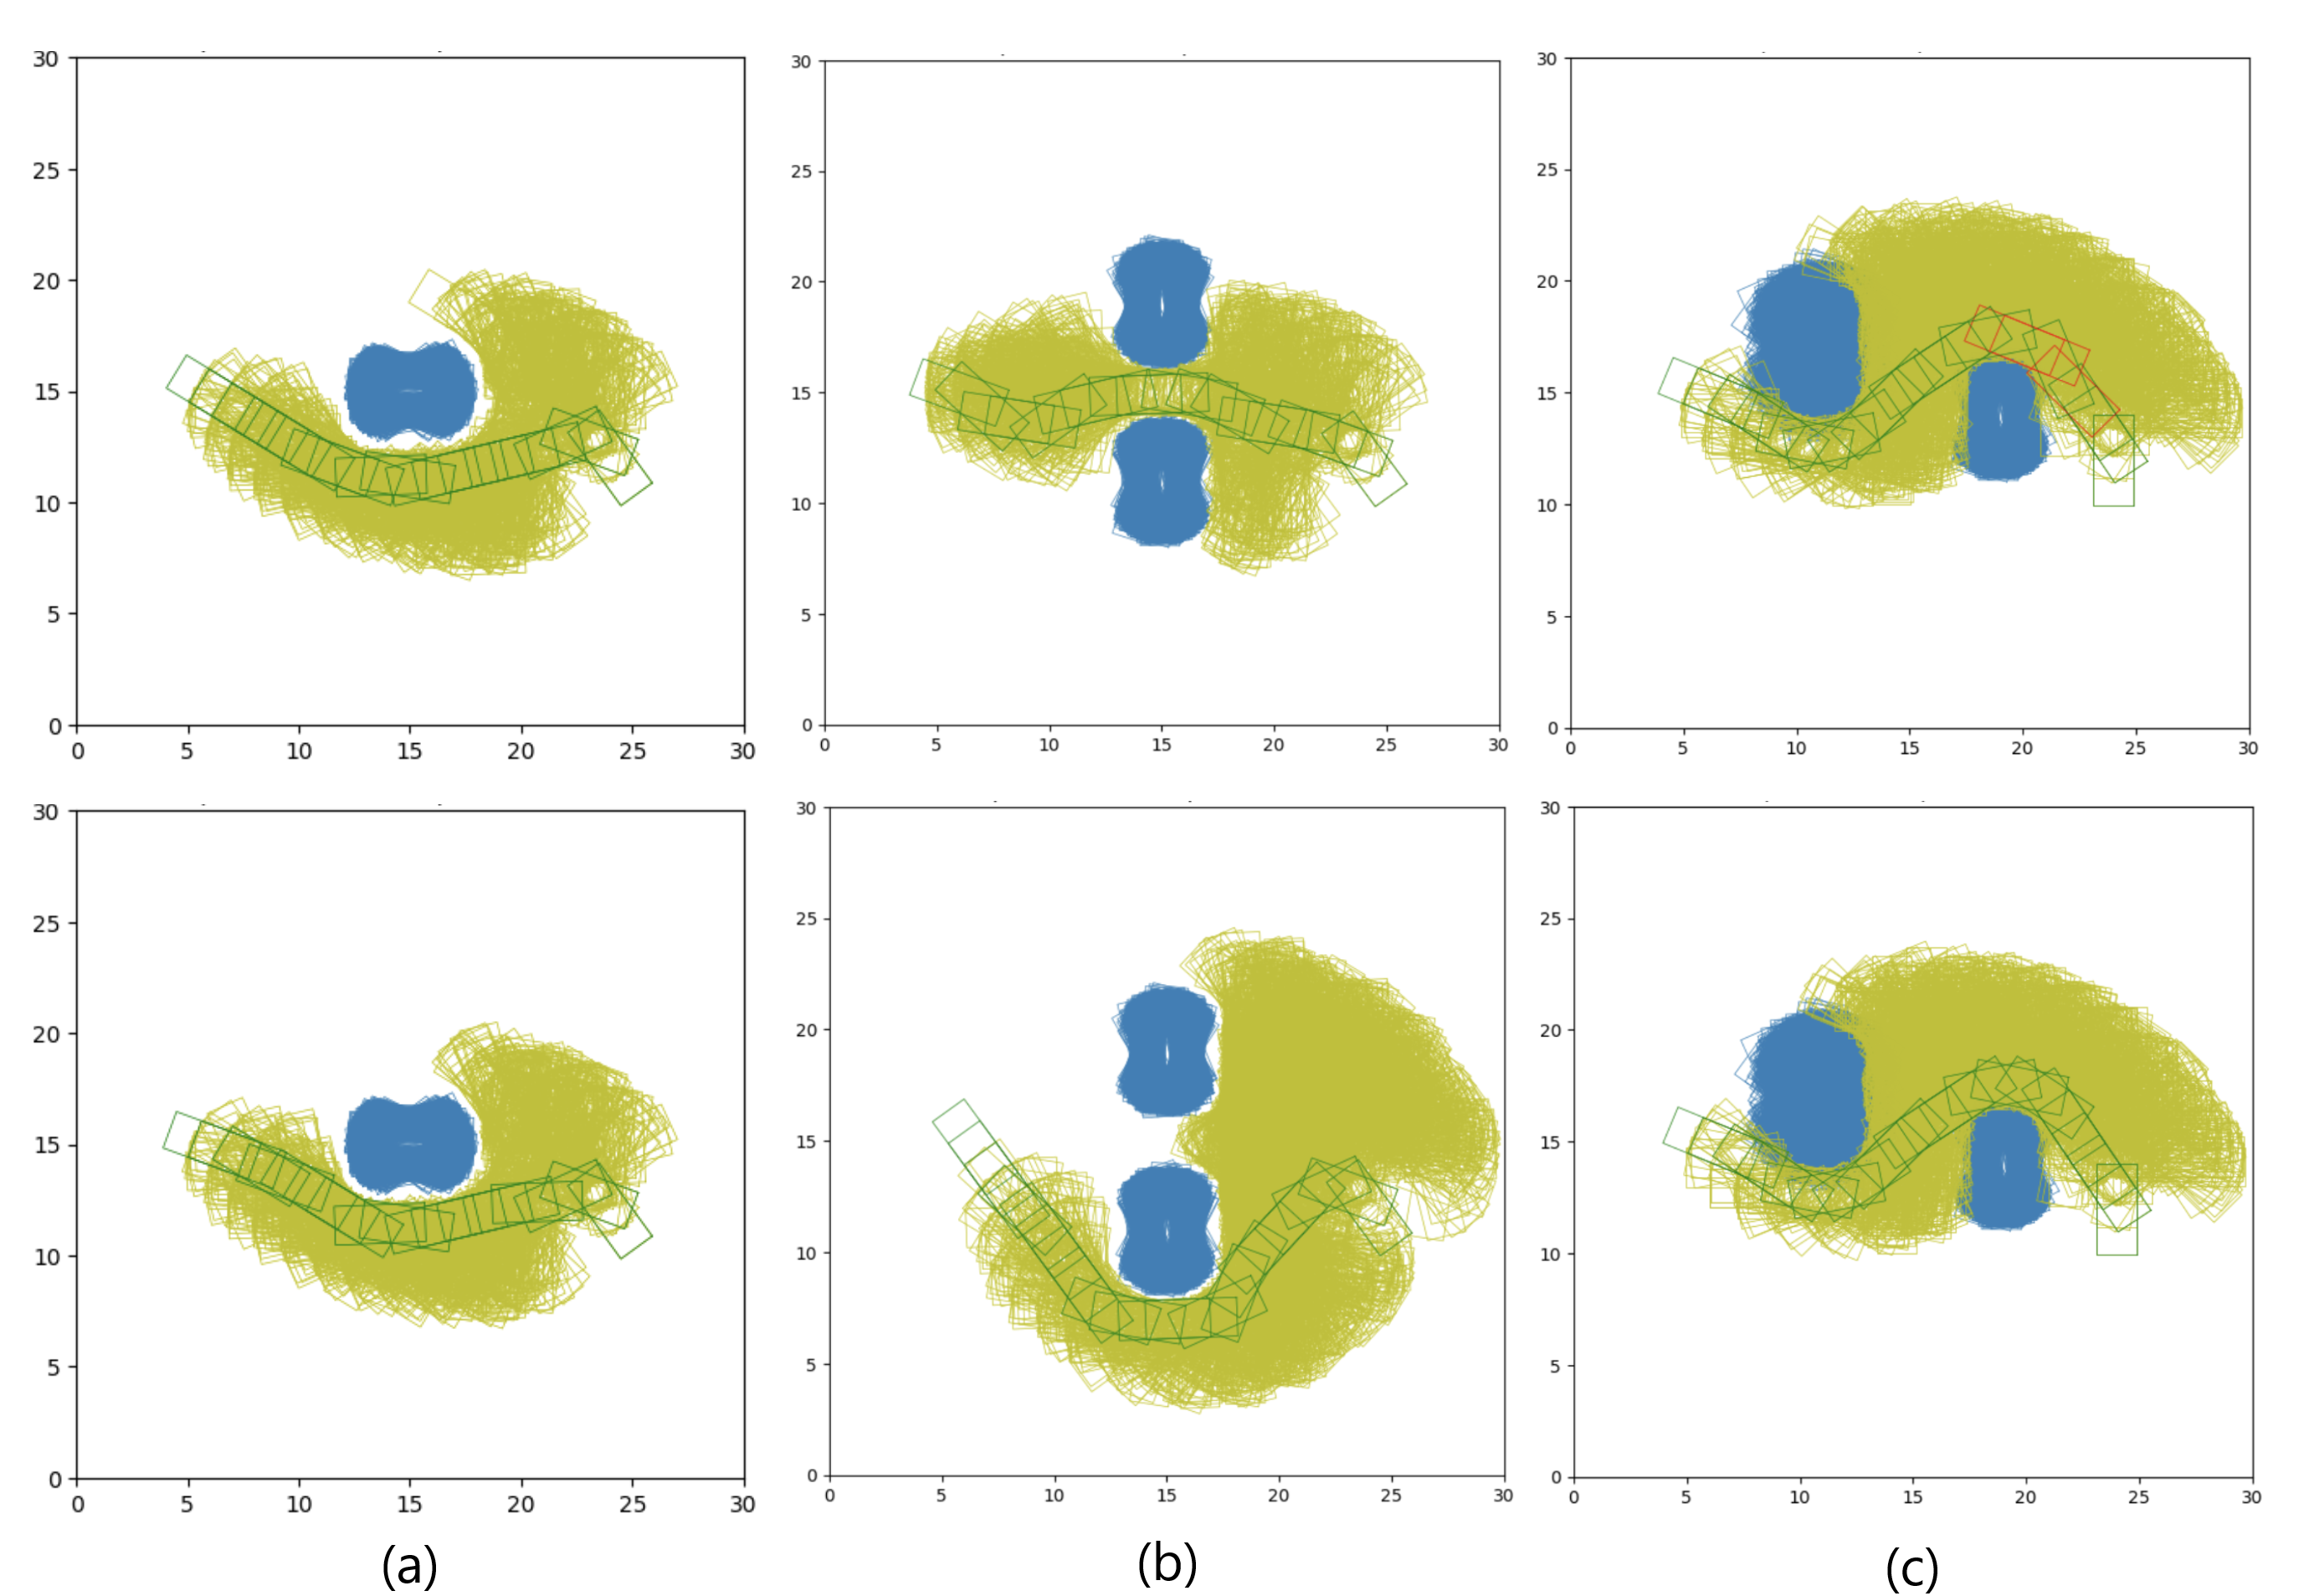
Figure 2: The columns (a)-(c) show the paths planned for experiments one to three under different collision constraints and prediction methods. Blue rectangles represent obstacles, green rectangles the found solution, yellow rectangles the explored states and red rectangles where the collision constraint was violated. The paths taken in (a) appear very similar, keeping slightly more distance in using max prediction. In (b) the planner only finds a valid solution that goes around the objects due to the higher collision constraint in the lower example. In (c) the solution contains two states that violate the collision constraint using mean prediction, while using the mean+ci prediction results in a valid path.