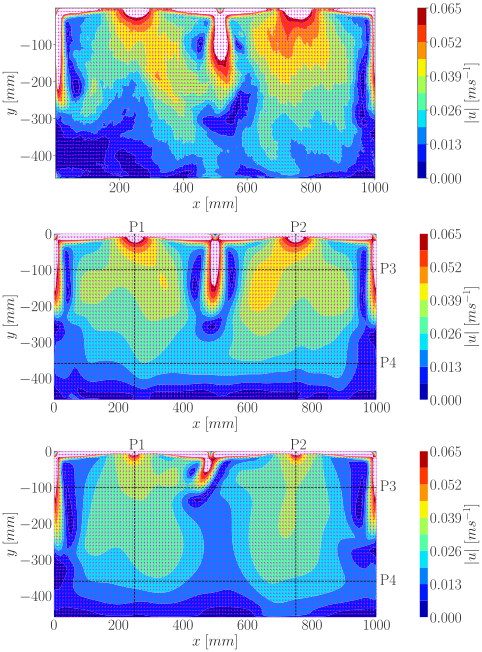
Bildunterschrift
Figure 1: Mean velocity contour plots for validation with PIV measurements. Only Ux and Uy are used to calculate the velocity magnitude. White areas in the contour plot mark |u| > 0.065 m s−1. Arrows indicate the direction.
Top: PIV mean velocity field in the central vertical plane of the room.
Middle: k-ω-ζ-f mean velocity field in the central vertical plane of the room.
Bottom: RNG k-ε mean velocity field in the central vertical plane of the room.