Bildunterschrift
Figure 2: Fe charge transition levels in STO, calculated with PBEsol using U correction. Different spin configurations were tested.
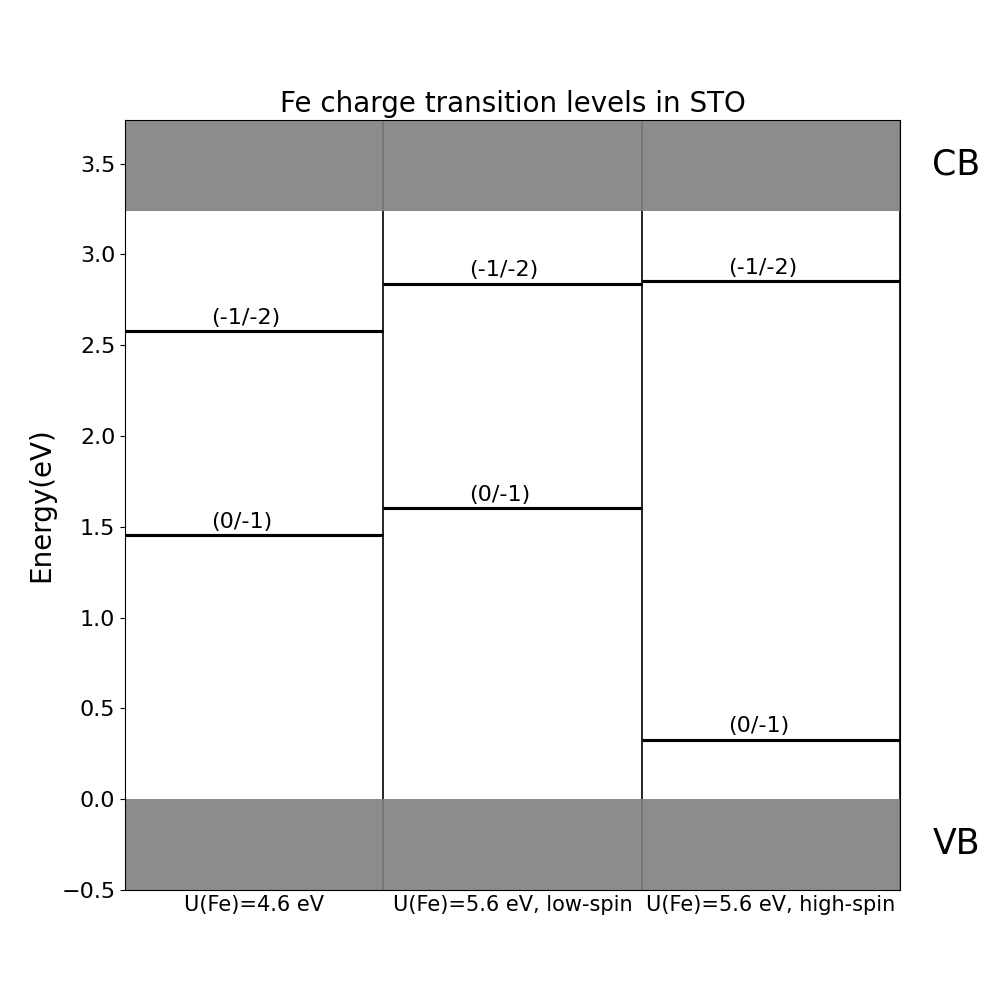
Figure 2: Fe charge transition levels in STO, calculated with PBEsol using U correction. Different spin configurations were tested.